
Fig. 5.
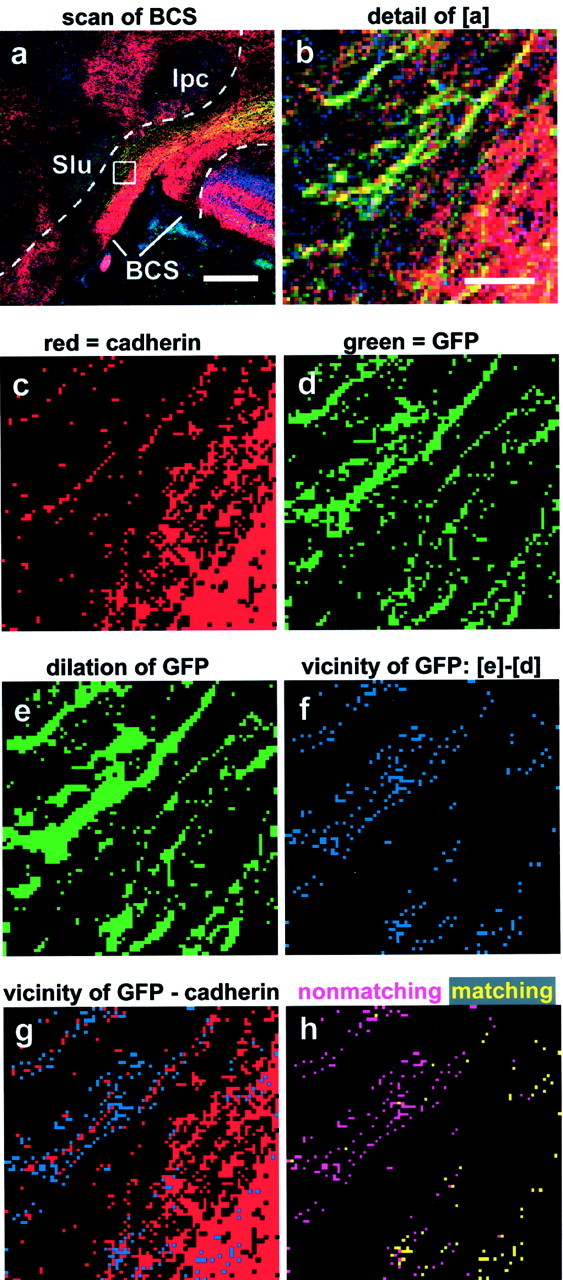
Outline of the quantitative image analysis procedure. a, Laser scanning image of cad7/GFP double transgenic axons reaching the BCS (cad7 staining in red, GFP in green, and nuclear staining inblue). The dashed lines mark the boundaries of the BCS used to electronically cut out the region of interest. Scale bar, 200 μm. b, Enlargement ofregion boxed in a to visualize single pixels. Scale bar (in b): b–h, 10 μm.c, Binarized image of the cadherin immunostaining.d, Binarized image of the GFP labeling.e, GFP labeling after one round of dilation to generate pixels covering the immediate neighborhood of the transgenic axons.f, Subtraction of the original binarized GFP image (d) from e generates pixels (blue) that represent the close vicinity of the transgenic fibers. g, Overlay of the vicinity pixels with the binarized pixels of the cadherin immunostaining (in red) to reveal those of the vicinity pixels, which match with the cadherin immunostaining.h, Yellow and pink pixels represent matching and nonmatching pixels, respectively. Note that cad7-overexpressing fibers outside the cad7-positive portion of the tectobulbar tract are correctly revealed as nonmatching. The quantification analysis was performed on scans of the whole BCS region like that outlined in a, and counting of pixels was performed by the computer.