
Fig. 5.
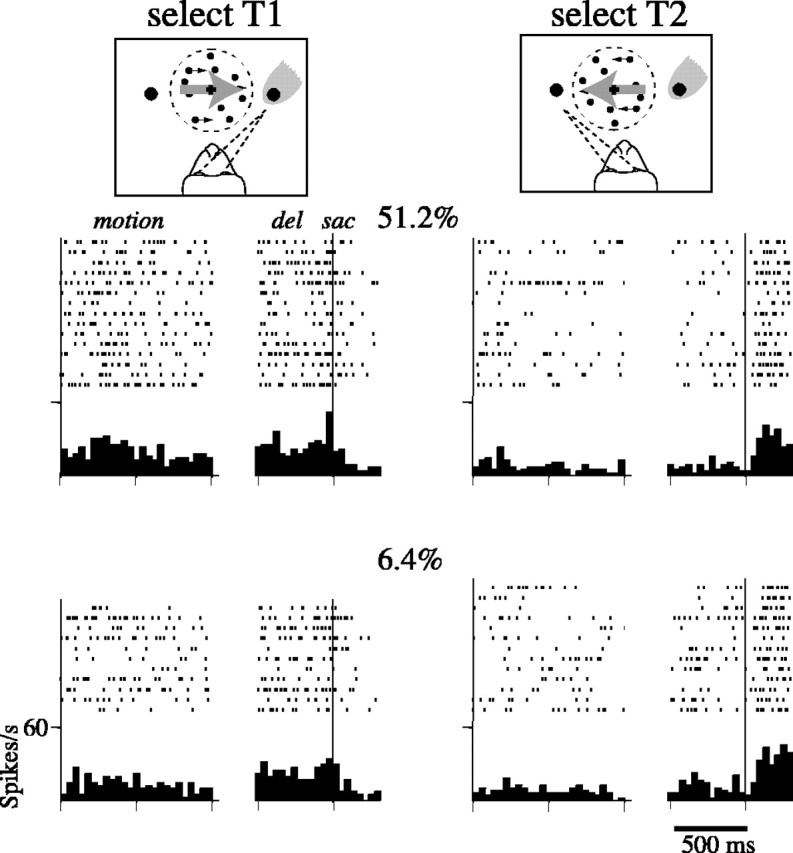
Response of an LIP neuron during the FD-direction-discrimination task. Data were obtained from the block of FD trials depicted in Figure 3 (same neuron as Fig. 4). The diagram at the top indicates whether the monkey's behavioral response was an eye movement into or out of the response field (gray shading). Spike rasters and histograms are aligned to two events in each trial. In the left portion of each axis, the responses are aligned to the onset of motion, which is then followed by a 1 sec motion-viewing period. In theright portion of the axes, the delay period (del) response is shown aligned to saccade initiation (sac). The break in the panel is attributable to the variable length of the delay period. The elevated spike rate accompanying T1 choices was more pronounced for the easier (51.2% coherent) motion (spike histogram binwidth = 20 msec).