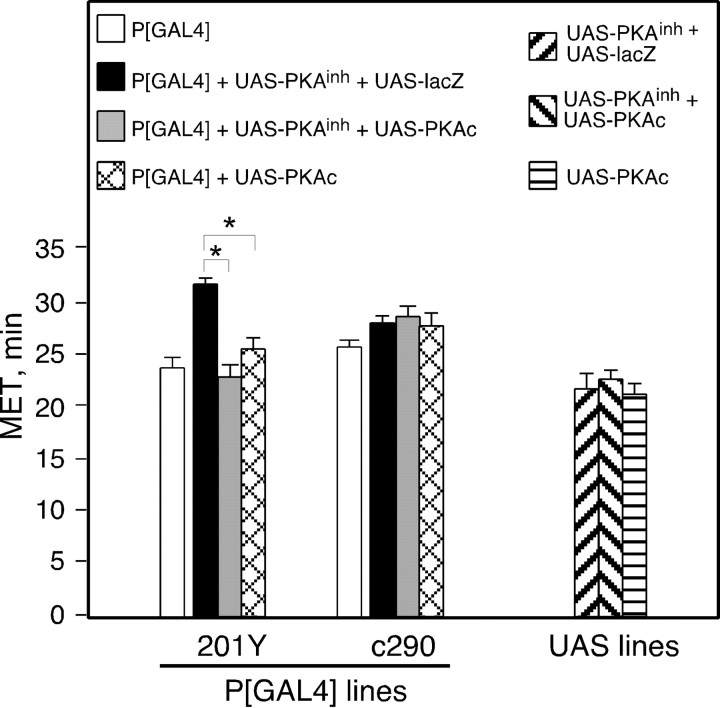
Fig. 3.
PKAc coexpression suppresses PKAinh-induced ethanol resistance. Flies of the indicated genotypes were tested in the inebriometer; METs are shown. Simultaneous expression of PKAinh and lacZ under the control of 201Y resulted in an increase in MET. This increase in MET was suppressed by coexpression of PKAc with PKAinh. Expression of PKAc alone did not alter MET, nor did the expression of any of the transgenes under the control of c290. The values for P[GAL4] were obtained from the experiments shown in Figure 1 and are displayed for comparison. One-way ANOVA revealed no significant effect of genotype for c290 (F(2,12) = 0.45;p = 0.647). A significant effect of genotype was observed for 201Y (F(2,12) = 45.5;p < 0.0001). Planned pair-wise comparisons with the critical p value adjusted to α = 0.0167 revealed a significant difference between 201Y+UAS-lacZ+UAS-PKAinh and both 201Y+UAS-PKAc+UAS-PKAinh and 201Y+UAS-PKAc (p < 0.0001 for both comparisons) but not between 201Y+UAS-PKAc+UAS-PKAinh and 201Y+UAS-PKAc (p = 0.019) (n = 4 for each UAS genotype; n = 5 for all others).Asterisks denote significant differences.

