Fig. 3.
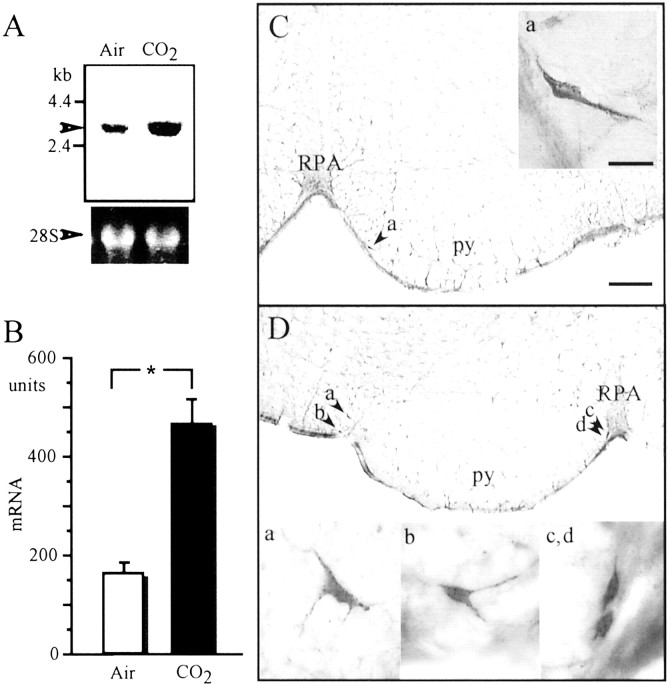
Induction of Past-A by hypercapnic stimulation in the medulla oblongata. A, Analysis of differential expression of Past-A by hypercapnic stimulation by Northern blotting. Representative example of autoradiogram sampled from four experiments. Arrowhead shows hybridizing band corresponding to mRNA encoding rat Past-A. Positions of standard molecular masses (in kilobases) are indicated at left. Ribosomal RNA (28S) stained with ethidium bromide is shown as a control. B, Histograms of density units of the expression of Past-A mRNA after air or CO2 inhalation. The content of Past-A mRNA was measured densitometrically on the autoradiogram, and the results are expressed as means ± SEM of arbitrary units of density (n = 4). The significance of differences in the density of Past-A mRNA was evaluated by the Mann–Whitney U test, with *p< 0.05 considered indicative of a statistically significant difference. C, Photomicrographs of Past-A-immunoreactive neural cells in the VMS after inhalation of air. Right, Magnified subregion indicated by arrow atleft. D, Photomicrographs of Past-A-immunoreactive neuronal cells in the VMS after inhalation of air containing 7% CO2 for 5 min. Bottom, Magnified subregions indicated by arrows attop. py, Pyramidal tract;RPA, nucleus raphe pallidus. Scale bars: panoramic picture, 200 μm; magnified picture, 20 μm.

