
Fig. 6.
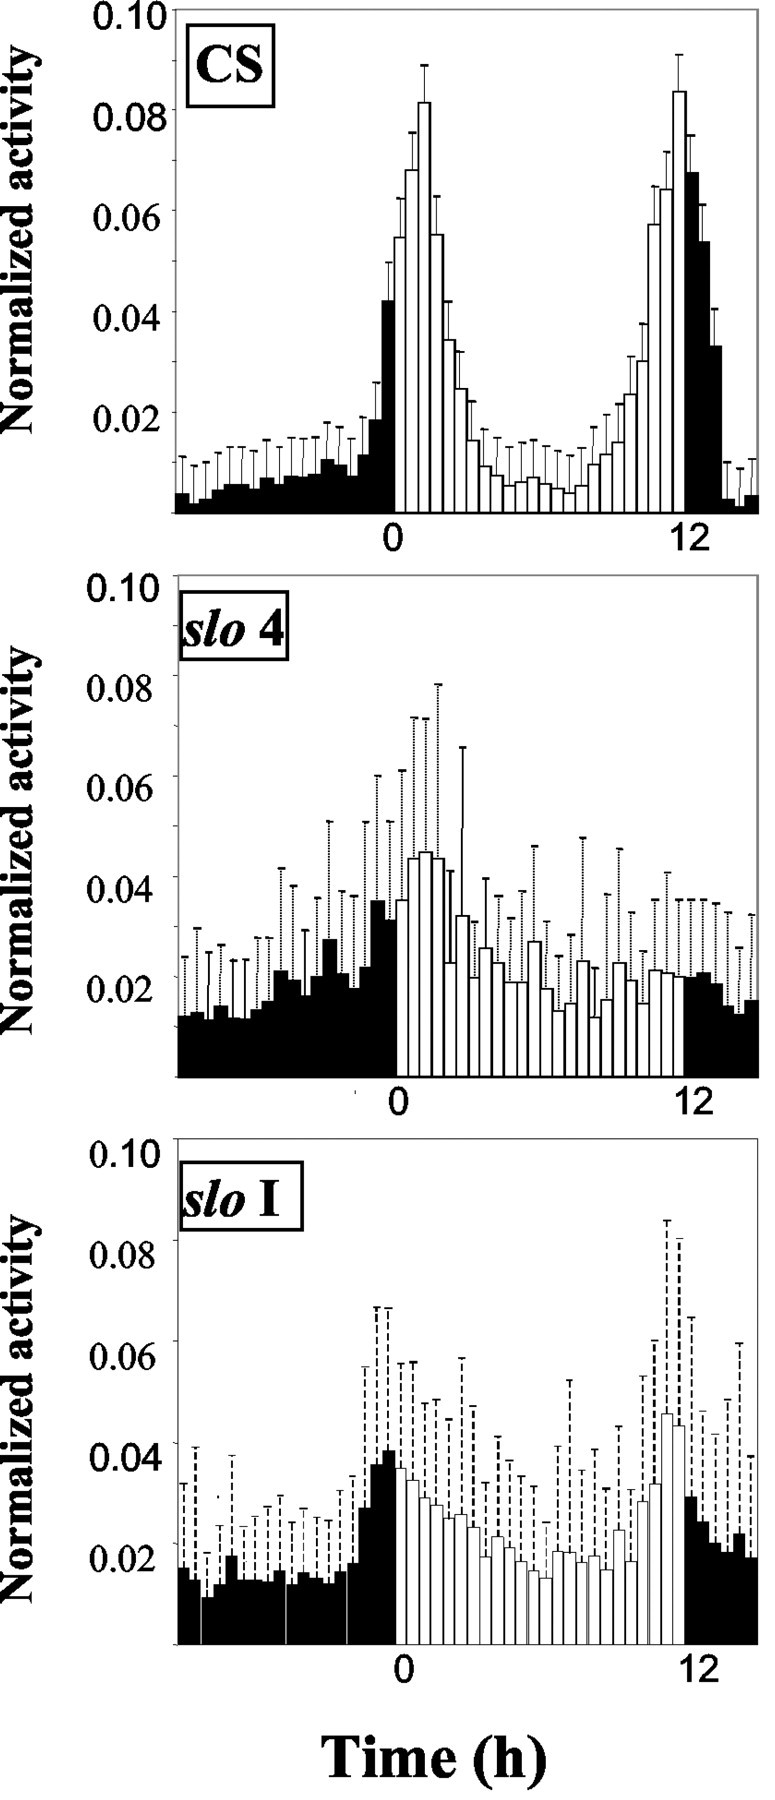
Mutations in slowpoke disrupt the consolidation of activity around the transitions. Average activity plots for CS, slo 4, and slo I mutant flies are shown. Activity records of the LD portion of the experiment for 53 wild-type, 28 slo 4, and 56 slo I flies were used for the analysis. To superimpose the separate animal records, the levels of activity were normalized per fly per day. Each vertical bar represents the mean ± SD.