Fig. 4.

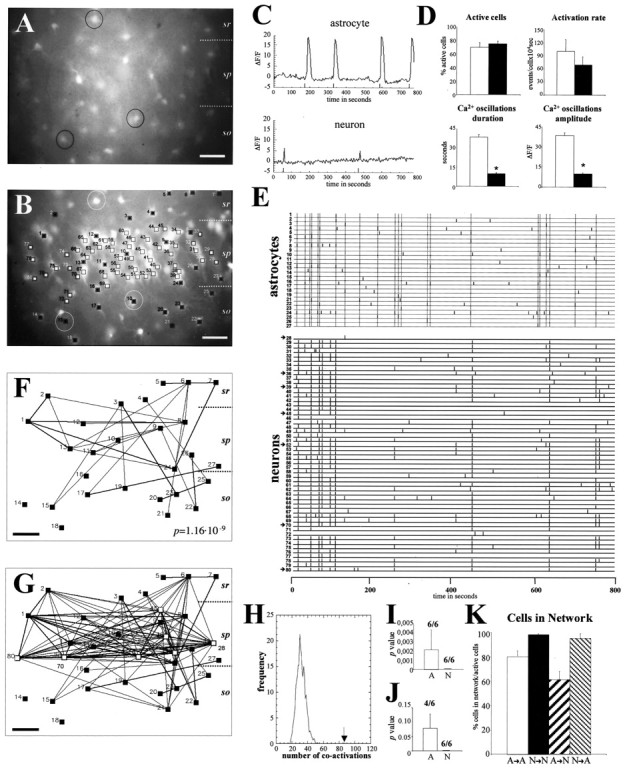
Spontaneous [Ca2+]i oscillations in hippocampal astrocytes belong to correlated neuronal/astrocytic networks.A, B, Paired fluorescence photomicrographs illustrating many GFAP/GFP-positive astrocytes (A) in the CA1 region of the hippocampus (P6) that are also labeled with fura-2 (e.g., cells in circles) (B). Fura-2-loaded cells showing spontaneous fluorescence changes over time are labeled by squares. Blacksquaresmark GFP-positive astrocytes, whereas GFP-negative neurons (located mainly in the pyramidal layer) are labeled by white squares. C, Representative plots of spontaneous changes of fura-2 fluorescence (ΔF/F) over 800 sec in astrocytes and neurons in the CA1 hippocampal region. The initiation of each [Ca2+]i oscillation is labeled by a thick mark at the bottom of the plot. D, Histograms illustrating properties of spontaneous [Ca2+]i oscillations in astrocytes (white bars) and neurons (black bars). Both the duration and amplitude of spontaneous Ca2+ activations are higher in astrocytes than in neurons, whereas the proportion of active cells and the rate of oscillations are similar in both populations. E, Raster plot representing the activation profile of each of the 80 active cells shown in B over 800 sec. In the raster plot, each active cell is represented by a line, and each thick line marks the initiation of a [Ca2+]i transient. Cells1–27 correspond to astrocytes, and28–80 correspond to neurons.Dotted lines in the astrocyte raster plot indicate simultaneous coactivation of at least two cells of the plot. Synchronous coactivation among large numbers of neurons can also be seen clearly. F, Correlation map illustrating each active astrocyte of B (black squares), in which cells with statistically significant correlation coefficients are connected by lines. The thickness of thelines is proportional to the degree of significance. Most active astrocytes appear to belong to a correlated network.G, Correlated map representing synchronous correlations among all the astrocytes (black squares) shown inF and seven representative neurons (white squares, arrows in raster plot). Observe how many astrocytes are synchronously connected with neuronal cells.H, Distribution of pairwise correlations found in the real data (arrow) and in 1000 simulations obtained by the Monte Carlo test (bell-shaped curve) of the astrocyte population shown in B. Note how the number of correlated events in the real data set (arrow) exceeds those expected by chance in simulated data. The correspondingp value is shown in F. I, Average of Monte Carlo p values showing the probability that the number of times that any two cells had simultaneous onset of activation was caused by chance. Although all cases in both astrocytes (6 of 6; A) and neurons (6 of 6;N) are significant (p< 0.05), astrocytic values are higher than neuronal ones.J, Average of Monte Carlo p values showing the probability that the number of times the same cells were activated simultaneously at least twice was caused by chance. Each set of neuronal populations gives a 0 p value (6 of 6;N), whereas in astrocytic cells only four of six cases are significant (p < 0.05) (A). Both I and Jillustrate the higher synchronous correlation level of spontaneous [Ca2+]i oscillations among neurons than among astrocytes. K, Histograms summarizing the proportion of spontaneous active cells with statistically significant correlation coefficients: among astrocytes (A→A), among neurons (N→N), percentage of astrocytes coactive with neurons (A→N), and percentage of neurons coactive with astrocytes (N→A). Statistical significance: *p < 0.0001. Scale bar, 40 μm.sr, Stratum radiatum; sp, stratum pyramidale; so, stratum oriens.
