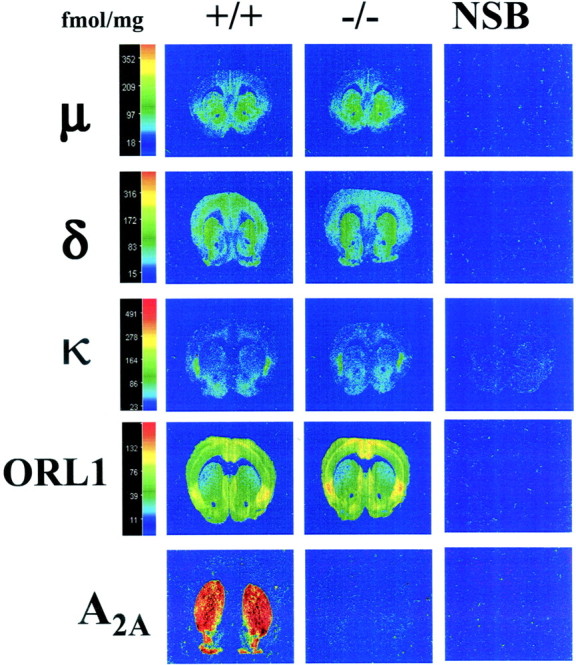
Fig. 1.

Computer-enhanced autoradiograms of coronal brain sections from wild-type (+/+) and homozygous (−/−) A2A adenosine receptor knock-out mice. All the sections shown are from the level of the caudate (bregma 1.34 mm, apart from A2A receptor-labeled sections, which were bregma 1.10 mm). μ receptors were labeled with [3H]DAMGO (4 nm), δ receptors with [3H]deltorphin-I (7 nm), κ receptors with [3H]CI-977 (2.5 nm), ORL1 receptors with [3H] nociceptin (0.4 nm), and A2A receptors with [3H]CGS216800 (10 nm). Nonspecific binding (NSB), shown in the far right column, was determined in the presence of naloxone (1 μm for μ and κ and 10 μm for δ), unlabeled nociceptin (100 μm for ORL1), or 5′-N-ethylcarboxamidoadenosine (20 μm for A2A). The color bar shows a pseudocolor interpretation of the relative density of the black and white film image calibrated in femtomoles per milligram of tissue. Sections from +/+ and −/− brains were processed in parallel.
