Fig. 4.

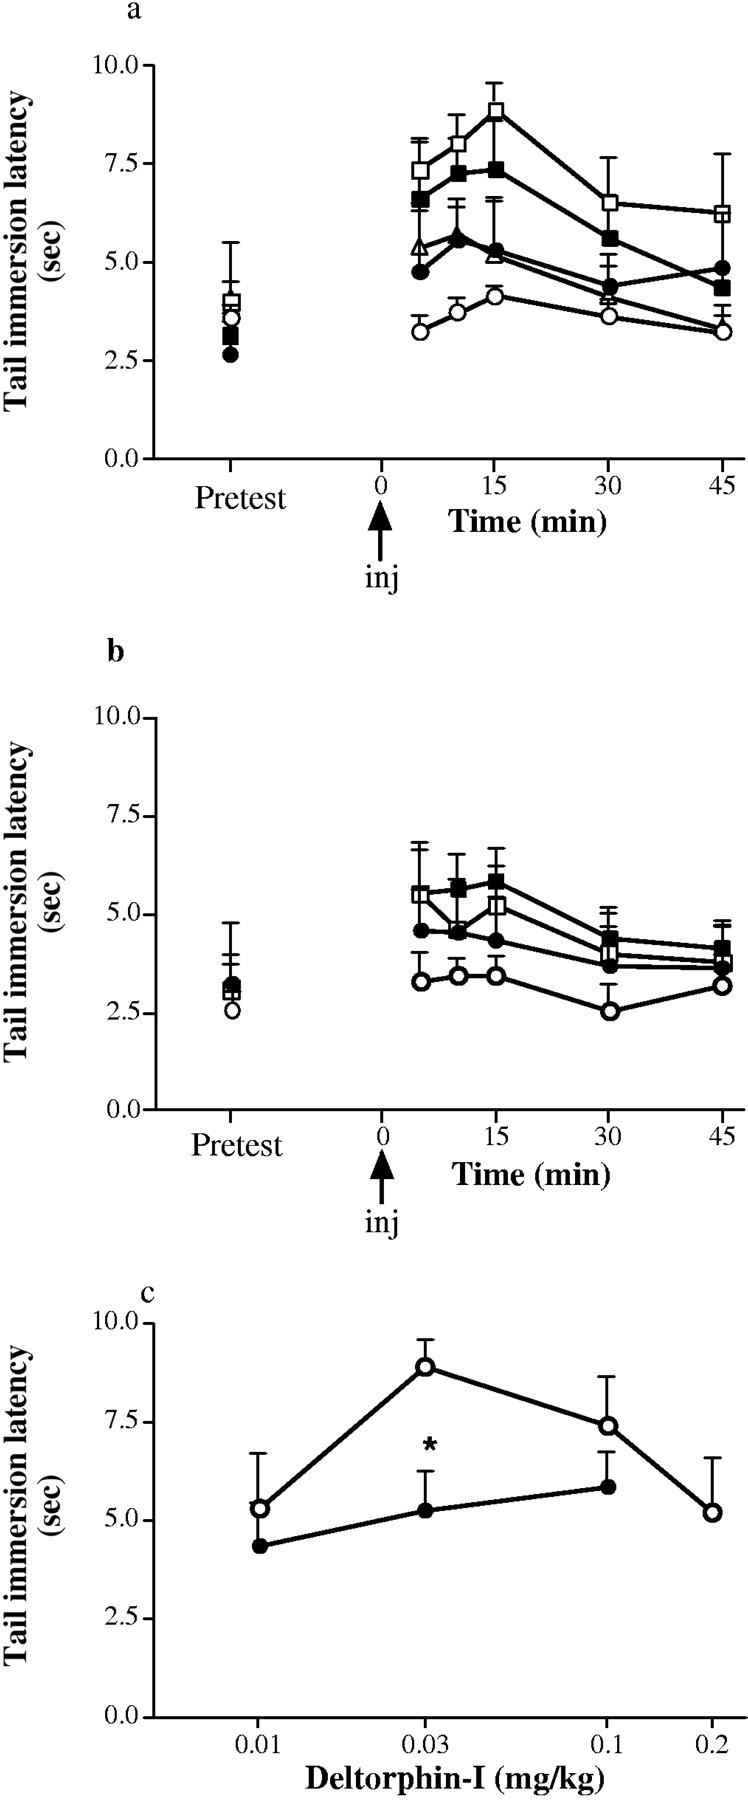
Dose-related antinociception induced by deltorphin-I in 12-week-old wild-type (+/+) and A2Areceptor knock-out (−/−) mice. a, Time course of deltorphin-I-induced antinociception in the +/+ mice; b, time course of deltorphin-I induced antinociception in the −/− mice measured as tail immersion latency at 52°C. ○ represents vehicle control values; ●, 0.01 mg/kg deltorphin-I; ■, 0.03 mg/kg deltorphin-I; ▪, 0.1 mg/kg deltorphin-I; ▵, 0.2 mg/kg deltorphin-I. Doses (0.1 ml volume, i.p) are administered at 0 min.pretest, Pretest responses 20 min before injection. c, Dose–response relationship for deltorphin-I at peak antinociception (15 min after injection) in wild-type (○) and A2A receptor knock-out (●) mice. Values are means ± SEM of five determinations (n = 5). Differences in dose–response curves between genotypes were statistically significant (p < 0.05; ANOVA); *p< 0.05 (Scheffe's post hoc analysis). The difference in tail immersion latency between +/+ and −/− vehicle-treated animals was not statistically significant (p > 0.05; ANOVA).
