Fig. 1.
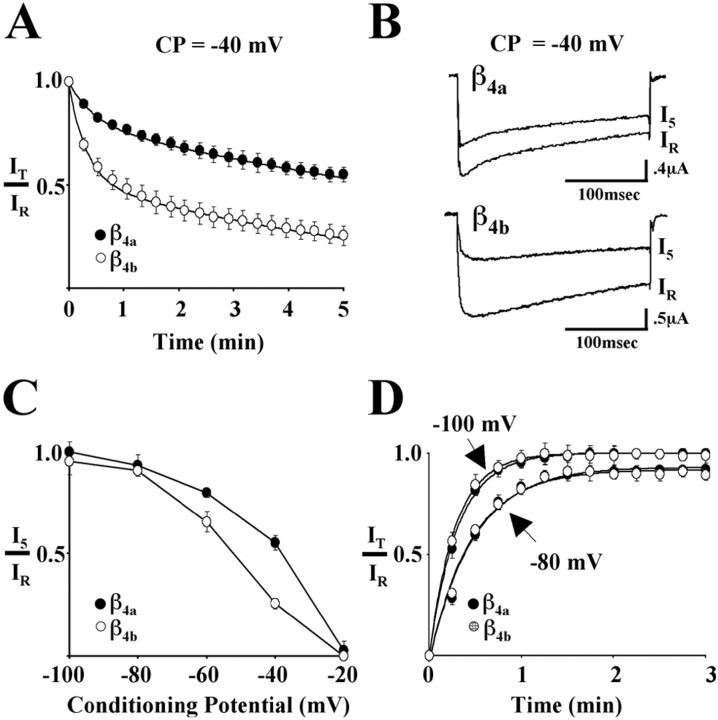
Effects of β4a and β4bon slow inactivation and recovery from slow inactivation of Cav2.1 Ca2+ channels. Studies were performed with Xenopus oocytes expressing α1A, α2/δ-1, and either β4a or β4b. Reference (IR) and test current (IT) traces were generated by 300 msec step depolarizations from various holding potentials to either 0 mV (β4b) or +10 mV (β4a). Maximum values from 300 msec IR andIT current traces were used to calculateIT/IRwhere indicated. Barium (5 mm) was used as the charge carrier. A, Influence of β4a and β4b on the development of slow inactivation at a conditioning potential (CP) of −40 mV. After a reference pulse (IR) measured from a holding potential of −80 mV, oocytes were held at −40 mV for 5 min. During this time, 300 msec test pulses (IT) were applied every 15 sec. Eachpoint represents the mean value ofIT/IR from 11 (β4a) or 10 (β4b) different recordings. The SEM is shown for each pointunless the values were smaller than the symbol. Thesolid lines represent double-exponential fits to the data. B, Representative reference (IR) and 5 min (I5) current traces from Cav2.1 complexes containing either β4a(top) or β4b (bottom) generated as described in A. C, Voltage dependence of slow inactivation. The ratio ofI5 to IR, generated as in A, plotted as a function of conditioning potential for Cav2.1 complexes containing either β4a or β4b. Data pointsrepresent the means of at least six determinations at a given membrane potential. Lines serve only to connect the data points. D, Influence of β4a and β4b on the time course of recovery from slow inactivation. After a 300 msec reference pulse (IR) measured from a holding potential of either −80 or −100 mV, oocytes were held at −30 mV for 5 min. The membrane potential was then returned to either −80 or −100 mV, and sequential test pulses (IT) were applied at 15 sec intervals for a total of 3 min. Eachpoint represents the mean of at least seven different recordings. Solid lines represent the single-exponential fits of the data.

