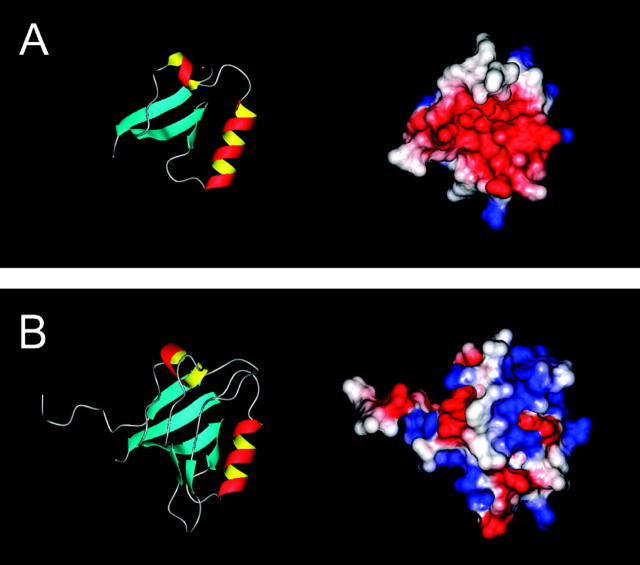
Fig. 5.
Real-space optimization structural models of the A domains of β4a (A) and β4b (B) based on sequence identities with the third PDZ domain of PSD-95. Ribbon (left) and electrostatic surface potential (right) diagrams were created using MOLMOL (Koradi et al., 1996). For ribbon diagrams, arrows indicate β-strands, and helices indicate α-helices. For surface potential diagrams, red, white, and blue regions indicate negatively charged, hydrophobic, and positively charged amino acids, respectively.

