
Fig. 7.
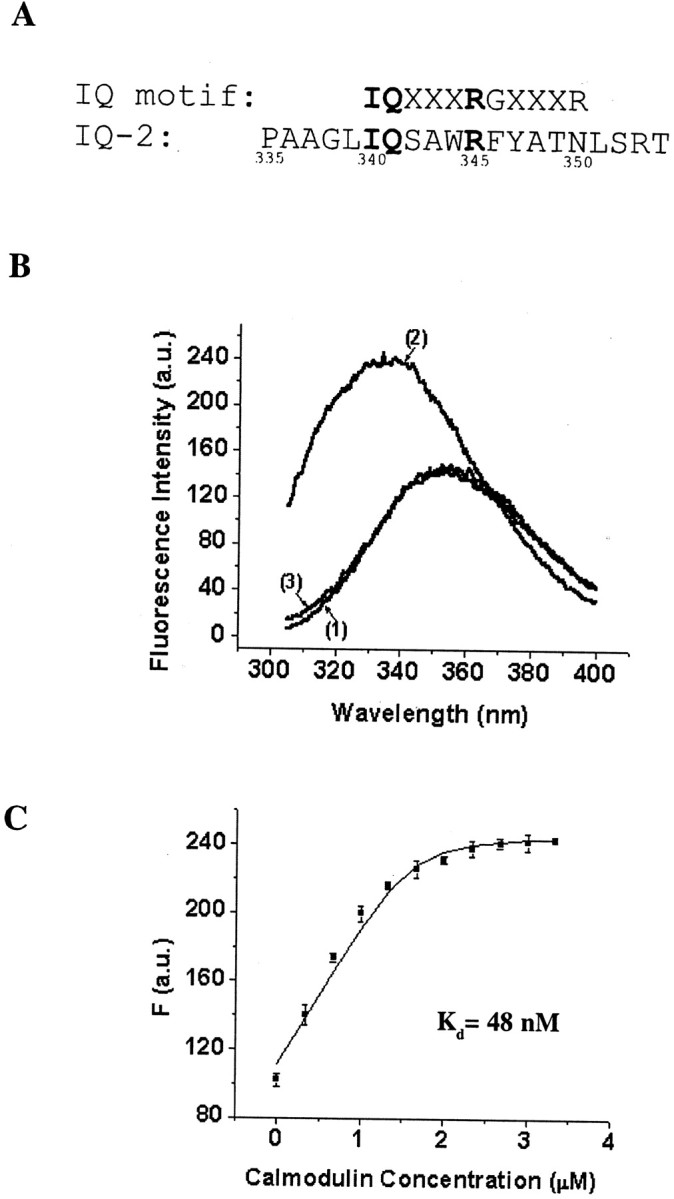
Fluorescence emission assay of the Ca2+-dependent interaction between an IQ-2 peptide and CaM. A, Alignment of the KCNQ2 IQ-2 sequence (bottom) with the canonical IQ motif (top), where X is any amino acid. Residues that are identical in the two sequences are highlighted inbold. B, Representative fluorescence emission spectra of 1.6 μm IQ-2 peptide alone in the presence of 1 mm Ca2+ or 1 mm EGTA (curve 1), 1.6 μm IQ-2 peptide with 3.33 μm CaM in the presence of 1 mm Ca2+ (curve 2), or 1 mm EGTA (curve 3). In the presence of 1 mm Ca2+ the addition of CaM blue-shifts the maximum emission wavelength and increases the fluorescence intensity (presented in arbitrary units, a.u.).C, Fluorescence titration of the IQ-2 peptide with CaM in the presence of 1 mm Ca2+. Fluorescence data from three independent experiments (mean ± SEM) are plotted against the CaM concentration. The line is the fit to a simple binding model: IQ-2 + CaM ↔ IQ-2·CaM. The dissociation constant, KD, is estimated at 48 nm. The quantum efficiencies of IQ-2 and IQ·CaM,FIQ, andFIQ·CaM are estimated to be 69.72 μm−1 and 154.65 μm−1, respectively.