
Fig. 4.
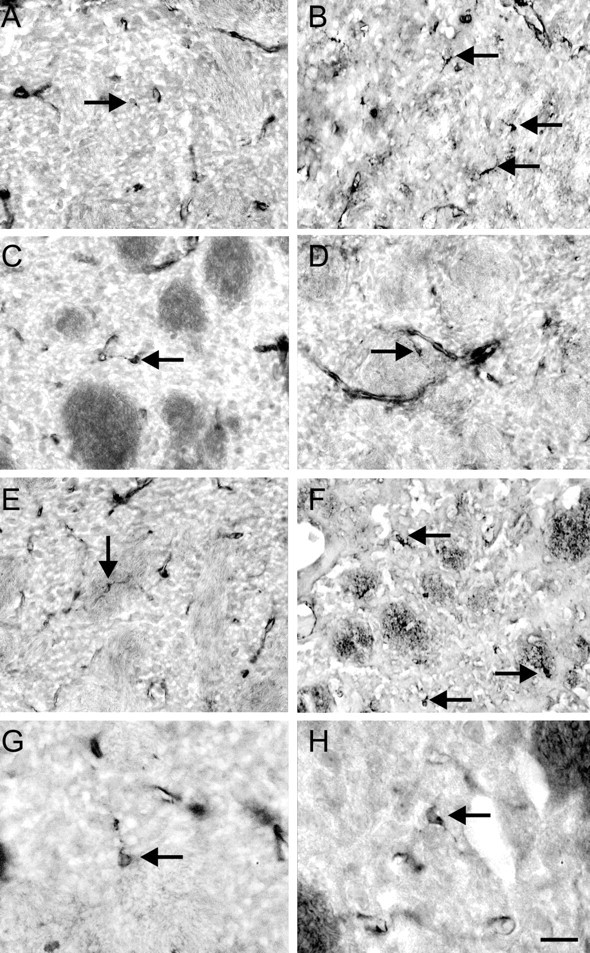
Photomicrographs showing examples of the density of GSI-B4-IR microglia in untreated animals and those with ∼50% lesions of the SNpc from WT (A, before;D; after), IL-1R(−/−) (B,E), and IL-6(−/−) (C,F) mice. Note the increase in density in WT and IL-6(−/−) mice, but it is not seen in IL-1R-deficient mice. Scale bar: A–F, 25 μm; G,H, 10 μm.