
Fig. 8.
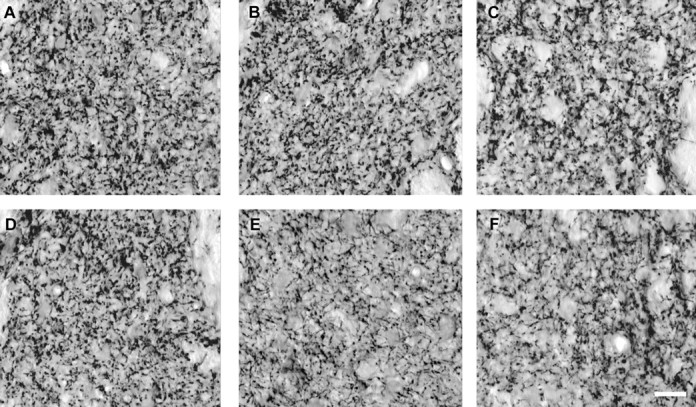
Photomicrographs showing examples of the density of DAT-IR terminals in untreated animals and those with ∼50% lesions of the SNpc from WT (A, before; D, after), IL-1R(−/−) (B, E), and IL-6(−/−) (C, F) mice. Note that density is maintained in WT mice after lesioning but is significantly reduced in both IL-1R- and IL-6-deficient mice. Scale bar, 20 μm.