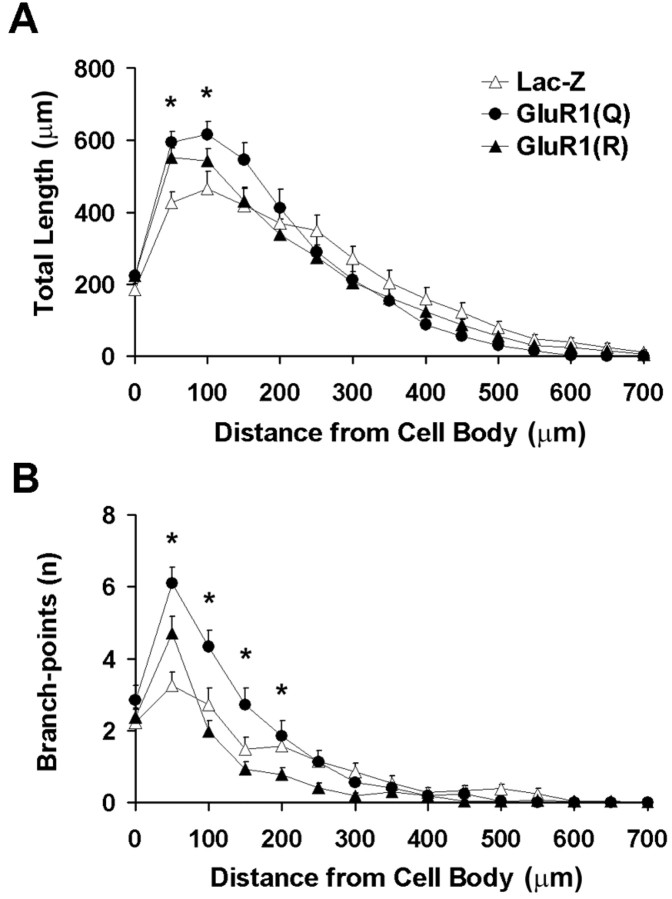
Fig. 4.
Sholl analysis of transgene-expressing motor neurons in the lumbar spinal cord. A, Total amount of dendritic arbor per cell. ●, GluR1(Q)flip; ▴, GluR1(R)flip; ▵, LacZ control. Repeated measures ANOVA revealed significant group × radius interaction (F(28,980) = 3.478; p < 0.001), with more dendritic arbor occurring closer to the cell body in cells expressing GluR1(Q)flip compared with other groups (Scheffé's post hoctest). In contrast, there was no significant difference between groups (area under curve; F(2,70) = 0.104;p = 0.902). B, Number of branch-points per cell, expressed as a function of distance from the cell body. Analyses confirmed both group differences [area under curve (F(2,70) = 12.123;p < 0.001) and a group × radius interaction (F(28,980) = 5.127;p < 0.001)], with significantly greater numbers of branch-points occurring in GluR1(Q)flip-expressing cells relative to other groups. Asterisks represent individual radial bins in which variance within groups were measured.

