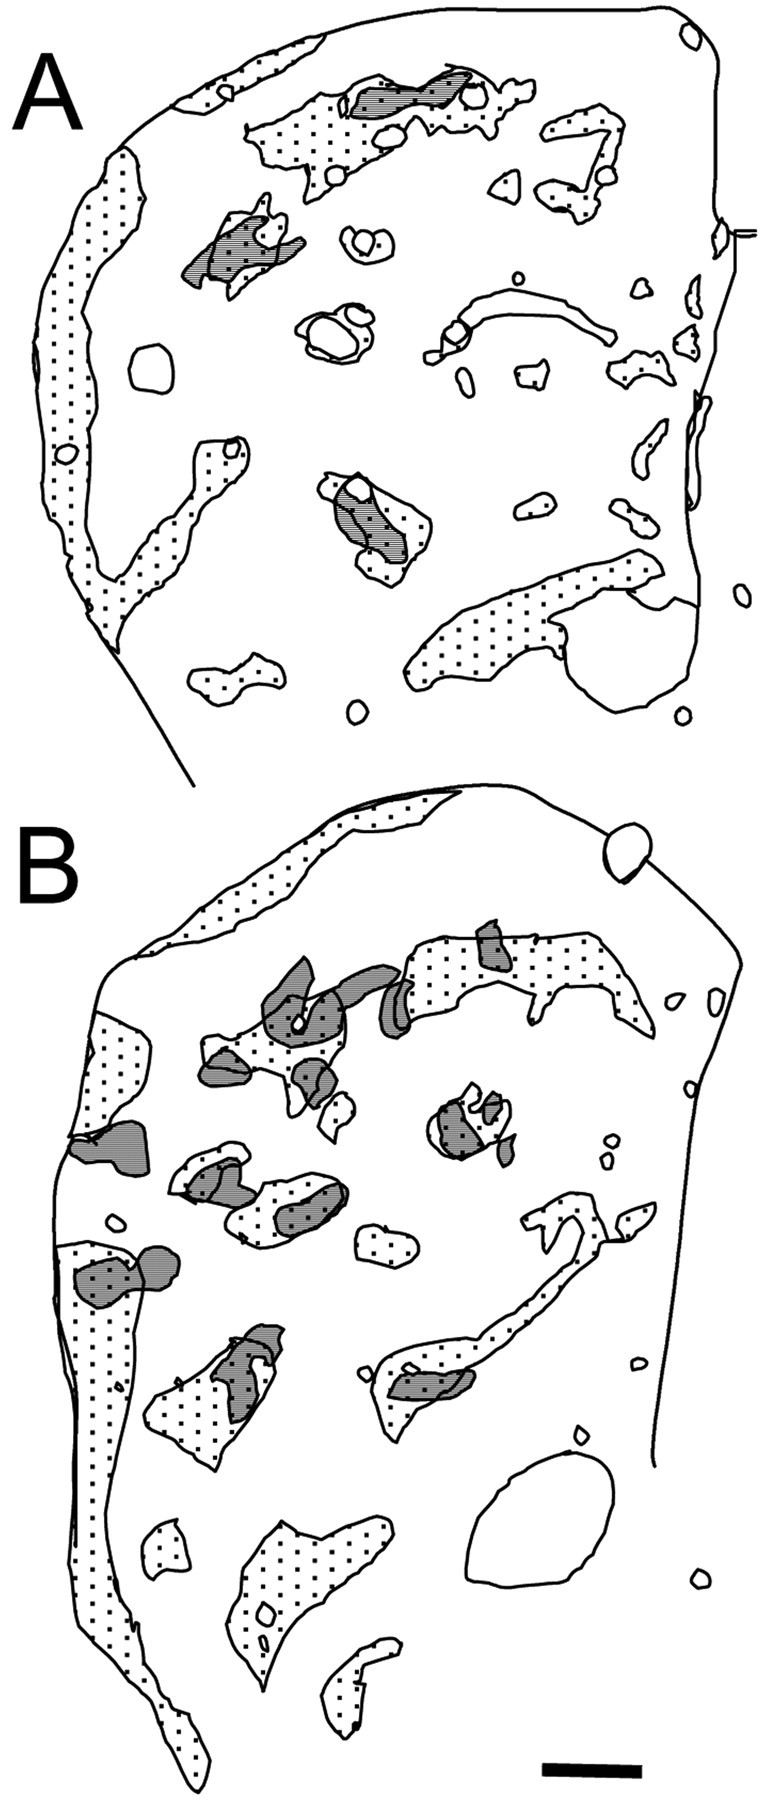
Fig. 8.

A, B, Maps showing MOR-1-positive areas (striosomes, represented as dotted areas) and cell clusters with intense EM48 immunostaining (represented as gray areas) in the striatum of 4-month-old (A) and 6-month-old (B) knock-in mice. Note the correspondence between the areas occupied by cells with intense EM48 immunostaining and the striosomes (represented as gray areas withdots). Scale bar, 0.2 mm.
