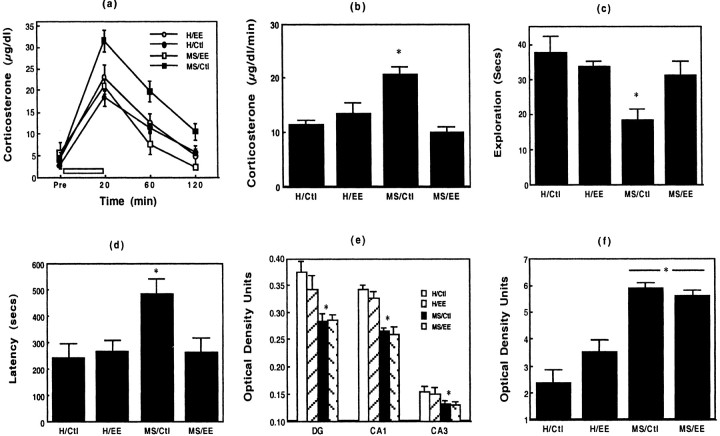
Fig. 1.
a, Mean ± SEM plasma level of corticosterone (in micrograms per deciliters;n = 8 per group) in response to a 20 min period of restraint stress (open bar) in H and MS animals reared under standard lab procedures (Ctl) or environmental enrichment (EE) during postnatal days 22–70 and tested on days 110–120. b, Mean ± SEM area-under-the-curve analysis for the corticosterone data displayed ina calculated using the trapezoidal rule.c, Mean ± SEM time spent exploring the inner area of a 2 × 2 m novel open-field environment (n = 8–10 per group). d, Mean ± SEM latency to begin eating food presented to food-deprived animals in a novel environment (n = 8–9 per group).e, Mean ± SEM levels of glucocorticoid receptor mRNA in the dentate gyrus (DG) and CA1 and CA3 cell fields of the hippocampus, expressed as optical density units, on autoradiograms from in situ hybridization studies with a35S-labeled riboprobe for the rat glucocorticoid receptor (n = 3–5 per group). f, Mean ± SEM levels of CRF mRNA in the paraventricular nucleus of the hypothalamus, expressed as optical density units, on autoradiograms from in situ hybridization studies with a35S-labeled oligonucleotide probe for the rat CRF (n = 3–5 per group).

