
Fig. 6.
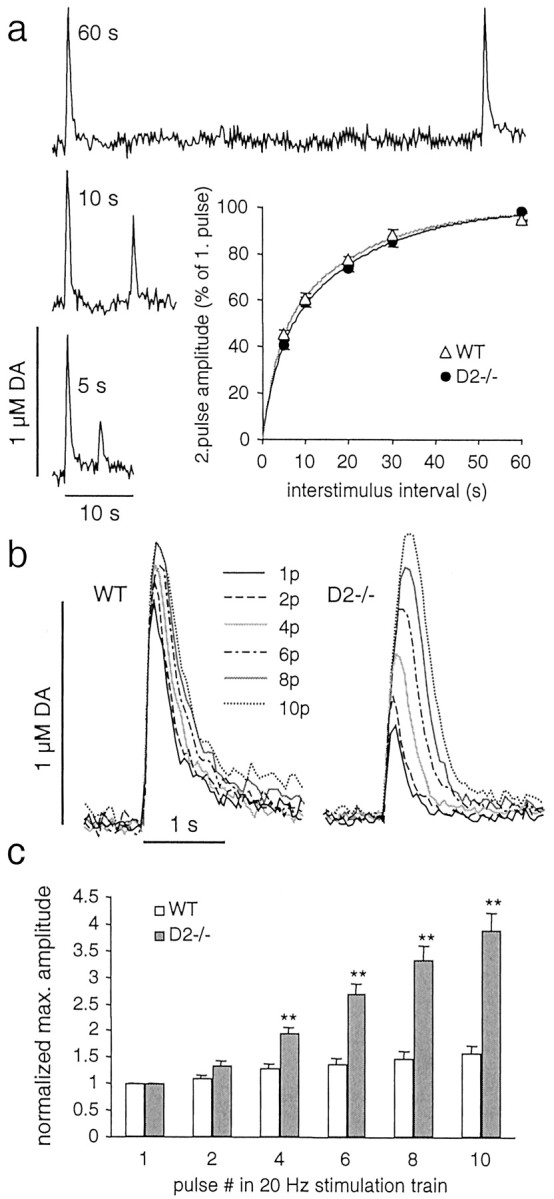
DA overflow in response to paired-pulse stimulation and train stimulation at 20 Hz in slices from D2−/− and WT mice. a, DA overflow recorded in slices from D2−/− mice (n = 5) and WT mice (n = 4) was evoked by paired-pulse stimulation with interpulse intervals of 5, 10, 20, 30, and 60 sec. Examples of recording traces are shown for a WT slice for 5, 10, and 60 sec interpulse intervals. The inset is a plot of PD expressed as maximal DA overflow evoked by the second stimulus in percentage of maximal DA overflow evoked by the first stimulus versus interpulse interval. The solid lines are double exponential fits to the data with the time constants τslow = 20 sec (62% in WT and 67% in D2−/−) and τfast = 3 sec (38% in WT and 33% in D2−/−). There was no difference between WT and D2−/− mice (p > 0.05).b, Examples of DA overflow, recorded in a slice from a WT and a D2−/− mouse, in response to stimulation trains of increasing pulse (p) number (1, 2, 4, 6, 8, and 10) with a frequency of 20 Hz. c, Average maximal amplitudes (mean ± SEM; double asterisksdenote statistical difference from WT with p < 0.01) obtained by stimulation trains as inb, normalized to the peak amplitude evoked by a single-pulse stimulation for D2−/− (n = 7) and WT (n = 7) mice.