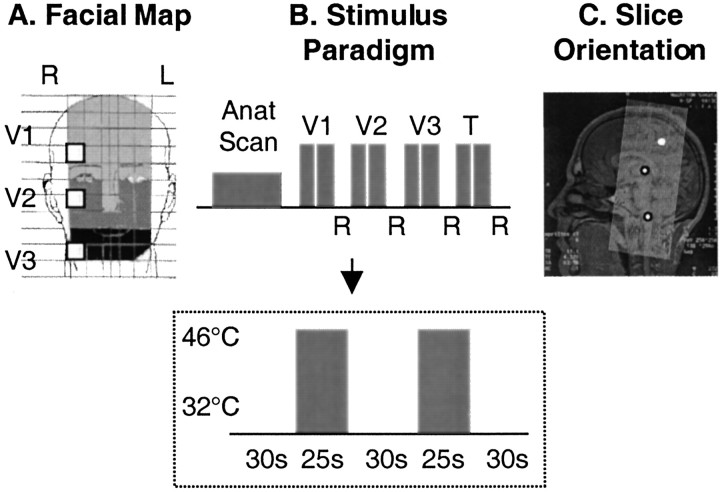
Fig. 1.
Experimental paradigm. A, Facial map. White squares denote location of the Peltier probe on the face. The three shades of graydifferentiate the regions innervated by the V1 (ophthalmic;light gray), V2 (maxillary; medium gray), and V3 (mandibular; dark gray) divisions of the trigeminal nerve. B, Stimulus paradigm. After the anatomical scan, the Peltier thermode was applied to the target area within the V1 distribution, and two 25 sec pulses of 46°C were given 30 sec apart with a baseline temperature of 32°C. After a 3 min interval, the stimuli were repeated with the probe in the V2 target region. The same procedure was used for the V3 region and finally for the palmar surface of the right thumb (T). After each set of stimuli, subjects rated their pain scores (R, visual analog rating of pain level from 0 = no pain to 10 = maximum pain imaginable). The time line for stimulus duration and interstimulus interval at each site is indicated within the box. C, Slice orientation. Shown is the orientation through the midsagittal section of the whole brain used for these experiments. Slices (n = 30) were oriented parallel to the brainstem. The circles show the location of the spV and thalamus and the approximate location of the SI (projected from its lateral location).

