
Fig. 5.
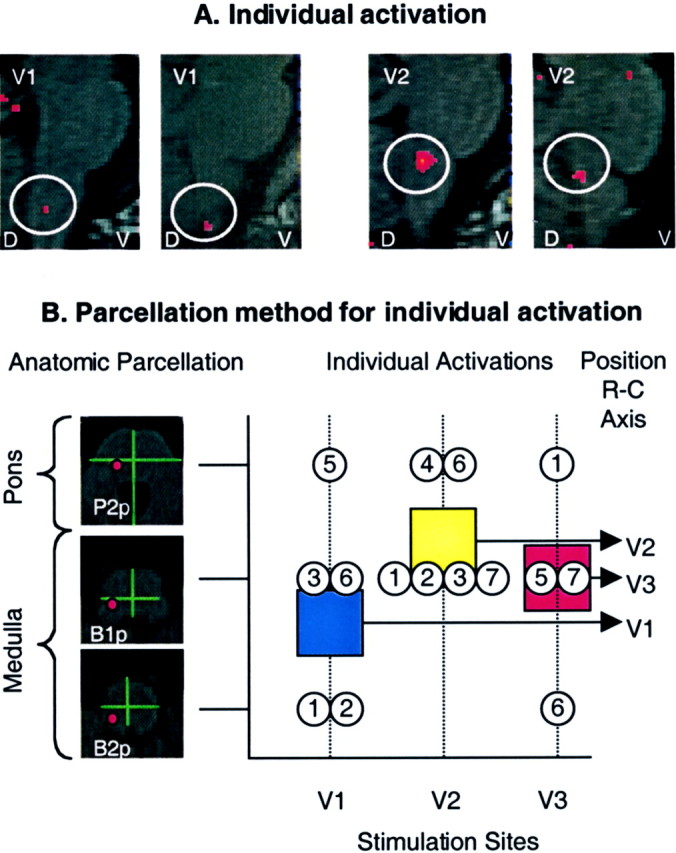
Individual analysis in the spV. A, Activation maps from single subjects. Shown are activation foci from two individuals mapped onto anatomical sagittal sections through the brainstem after a thermal stimulus to V1 or V2. D, Dorsal; V, ventral. B, Individual activations based on the parcellation method of the brainstem.Left panel, The parcellation for the pons and medulla is shown on the left. The red circlesrepresent the expected areas containing the spV in P2p(caudal pons), B1p (rostral medulla), andB2p (caudal medulla). Right panel, Individual activations after stimulation to facial sites V1, V2, and V3 were localized according to the brainstem level using the parcellation method shown in the left panel. The mean frequency of activations, plotted as squares, shows the same rostrocaudal (R-C) somatotopy as for group average activations using a different approach as shown in Figure4B. Blue square, V1; yellow square, V2; red square, V3.