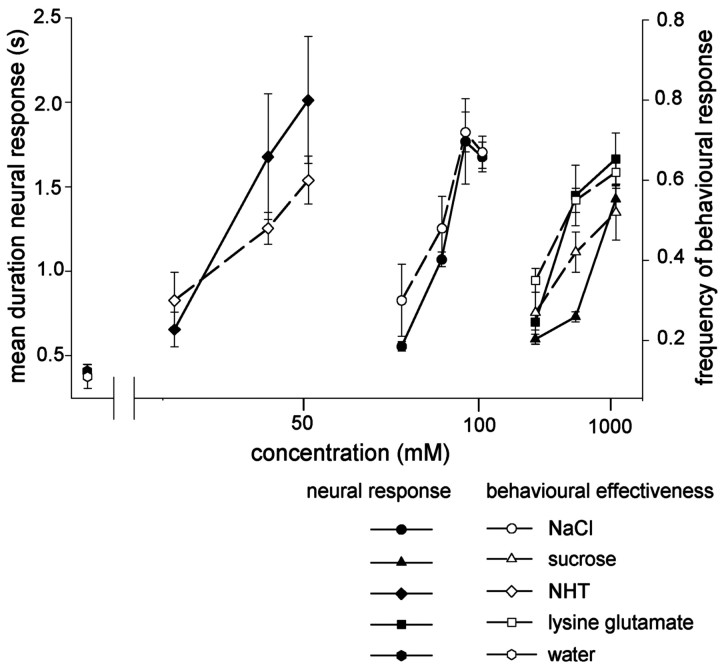
Fig. 11.
The response durations of spiking local interneurons correspond closely with the behavioral effectiveness of different chemical stimuli at different concentrations. Thefilled symbols show the mean ± SEM response durations (left ordinate) of spiking local interneurons to each of the test chemical stimuli at different concentrations (abscissa). Data were normalized so as to give the same mean response to water to minimize the variability associated with the different phasotonic response characteristics of individual neurons (Fig. 2). The behavioral effectiveness (right ordinate), as measured by the frequency of locusts withdrawing their legs from droplets of chemical stimuli at different concentrations, are shown by the open symbols (mean ± SEM) (data from Rogers and Newland, 2000). There is a Pearson correlation of 0.91 (p < 0.001;n = 14) between behavioral effectiveness and duration of interneuron response.

