
Fig. 6.
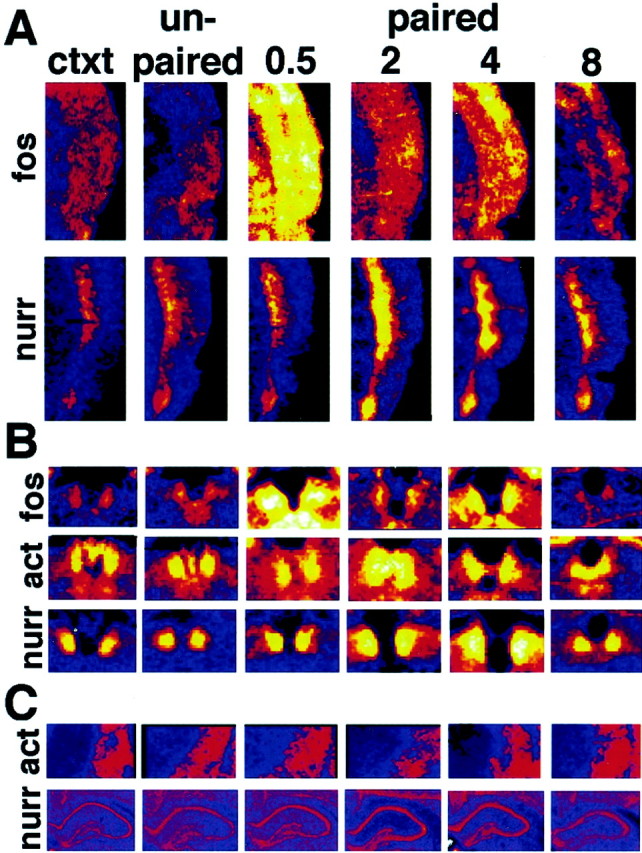
Gene expression changes in the cortex and habenula with fear conditioning. A, Pseudocolor images ofin situ hybridization with the genes indicated in the associative somatosensory (S2), parietal, perirhinal, and insular cortices as outlined in Figure 3A by the blue box. The color palette is the same as in Figure3B, with black showing no signal,blue showing the least mRNA expression, andyellow to white showing the most mRNA expression. Sections are shown after in situhybridization with the indicated genes for the context (ctxt) and unpaired controls and at 30 min and 2, 4, and 8 hr time points after odor-shock pairing. B, Pseudocolor images as in A from the habenula as outlined in Figure 3A by the green box.C, Pseudocolor images as in A from the caudate (act) or hippocampus (nurr) showing that α-actinin and nurr-1 do not show significant changes in these regions after fear conditioning.