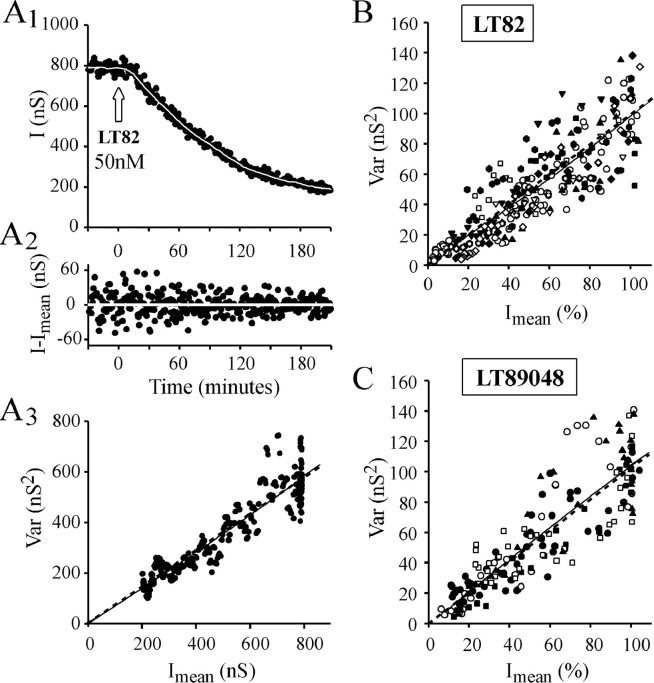
Fig. 11.
Graphical determination of n as the quantal parameter modified by LT action. A, IPSC fluctuations during the course of LT82-induced blockage of ACh release were analyzed by nonstationary analysis using a window width for local linear fitting w = 33, and variance windowW = 21. A1,I = f(t) plot. The set of Imean is represented by asolid white line. A2, The result of subtracting I values fromImean. A3, The corresponding Var =f(Imean) plot.B, C, The Var =f(Imean) plots from experiments in which either LT82 (n = 11) or LT9048 (n = 5) was injected. Individual plots are indicated by different symbols and are scaled to theImean and Var values determined before LT injection. For clarity, only 1 point of 10 is plotted.A3–C, The adjustment of the data by linear (solid straight line) or nonlinear regression analysis (dashed curves) is presented. Forr2 values see Results. The linear Var =f(Imean) relationships indicate that Imean diminution is caused by a decrease in n, the number of active release sites.

