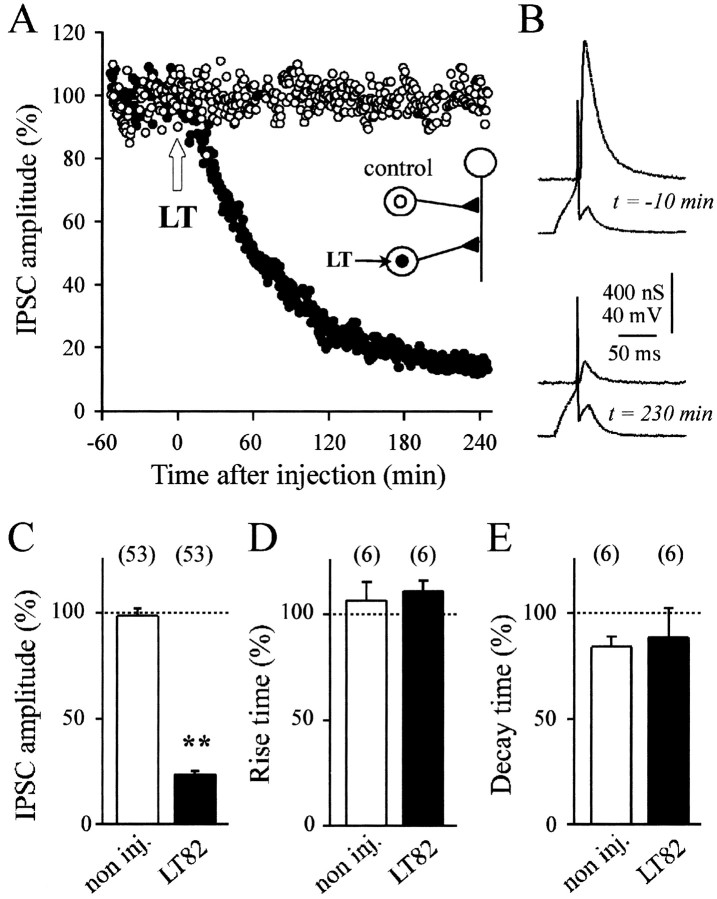
Fig. 2.
Inhibition of evoked ACh release by LT toxins that inactivate small GTPases. A, A representative experiment is illustrated. ACh release was evoked at identified synapses in the buccal ganglion of Aplysia californica. Seeinset for a schematic drawing of the neuronal connections. The amplitude of the IPSCs (percentage of average IPSC in control period) is plotted against time, before and after pressure injection of lethal toxin from C. sordellii(LT) into one of the two presynaptic cholinergic neurons (●). The final concentration of LT in the cell body was ∼50 nm. The second presynaptic neuron (○) was not injected.B, Recordings of presynaptic action potentials and IPSC at the time indicated before and after injection of LT. The mean IPSC amplitude (C) and mean percentage changes in the IPSC rise time and decay time (D, E) were determined 180 min after the time of toxin injection for noninjected (open bars) and LT82-injected (filled bars) neurons and normalized with respect to the mean values observed before the time of toxin injection. The numberof experiments is indicated. C–E, ** denotes significant difference (p < 0.001) as compared with the controls; other comparisons are nonsignificant (p > 0.5).

