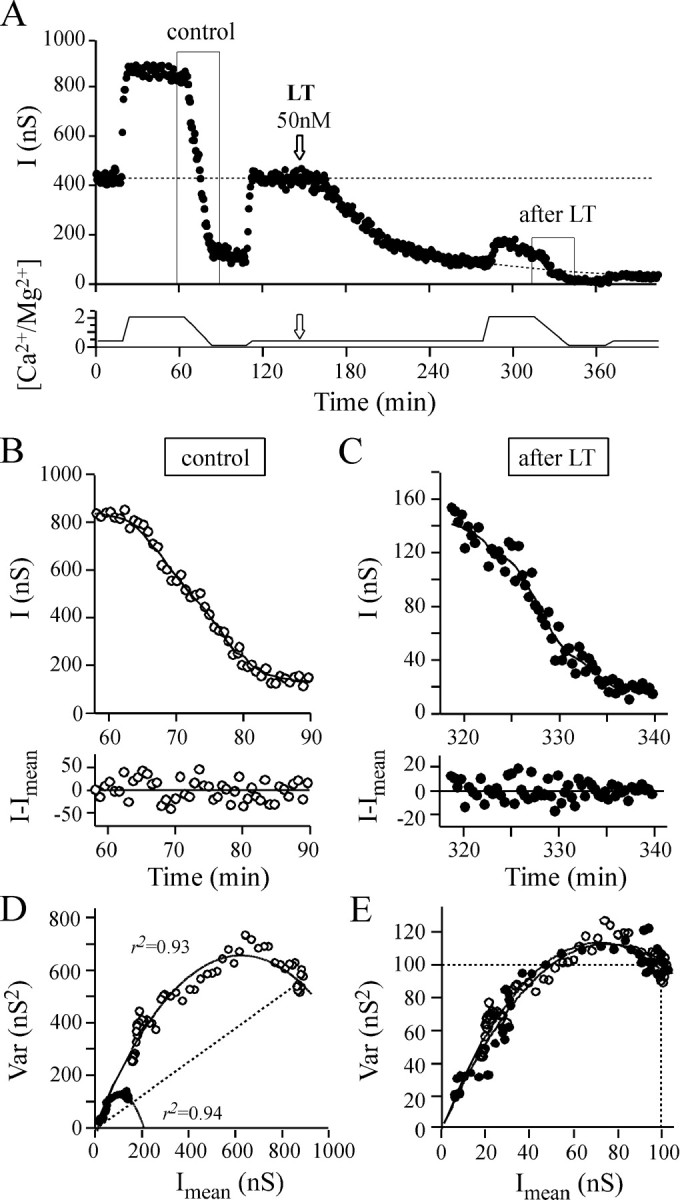
Fig. 7.

The effect of changing extracellular [Ca2+/Mg2+] before and during LT action. The experiment illustrated is representative of a series of five performed under the same experimental conditions.A, To determine the quantal parameters before and after LT82 application, extracellular [Ca2+/Mg2+] was modified between 2.1 and 0.14 as indicated in the bottom panel.Arrow denotes the time of LT injection. Solid lines denote the set of Imeandetermined by nonstationary analysis (with w = 9). The horizontal, long-dashed line denotes average I in the control period with [Ca2+/Mg2+] = 0.42.Dashed line (after LT) denotes the extrapolated I values (by sigmoid fitting) that would have been obtained without changing extracellular [Ca2+/Mg2+]. B,C, Top panels, Magnification of theI = f(t) plot portions boxed in A;bottom panels, the result of subtracting I values from the Imean estimated using nonstationary analysis. D, E, The corresponding Var = f(Imean) plots before (○) and after (●) LT action. The dashed straight line indicates that the initial release probability observed with [Ca2+/Mg2+] = 2.1 was similar before and after LT. In D, the plots have been scaled to the Imean observed before changing [Ca2+/Mg2+] and to the corresponding averaged Var. The identical initial slope of the parabolas indicates that quantal size, q, is not modified by LT.
