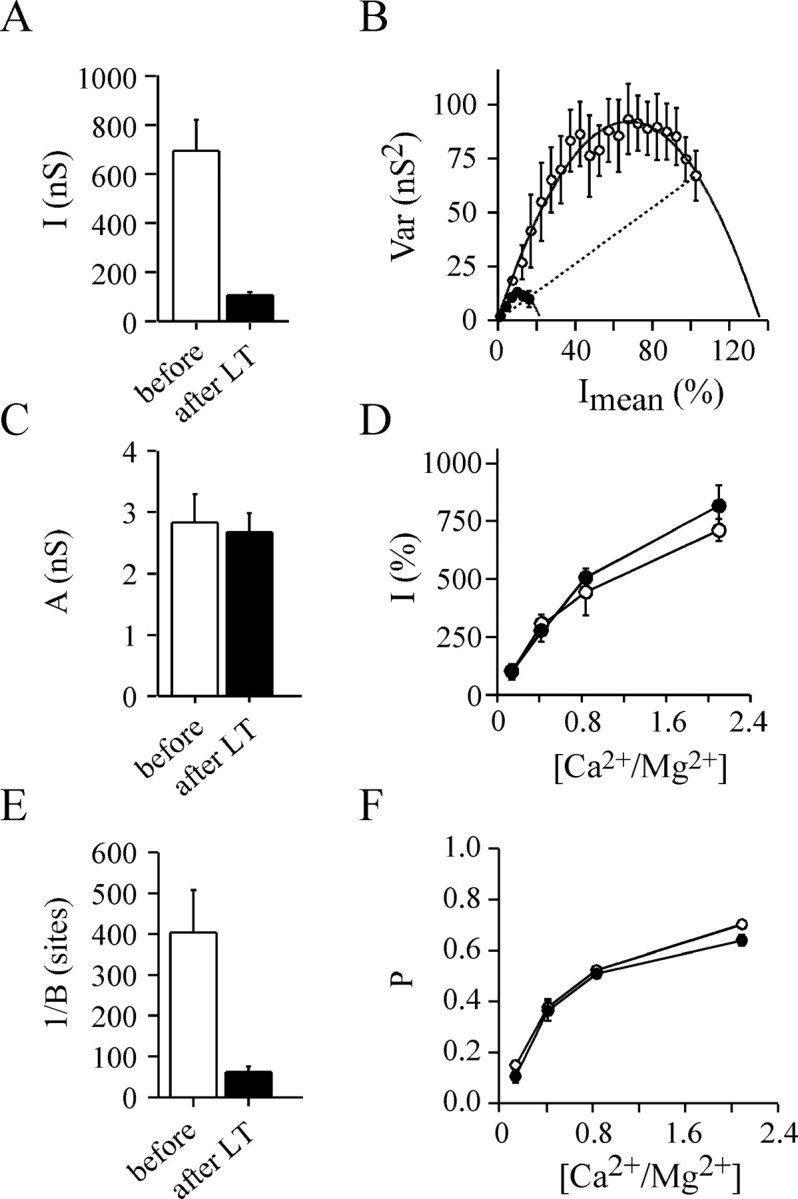
Fig. 8.

Determination of the parabola parameters affected by LT action using the fast change in extracellular [Ca2+/Mg2+] protocol. Five experiments similar to that illustrated in Figure6B were analyzed before (open barsor open symbols) and 190 ± 20 min (mean ± SD) after LT injection (closed symbols or filled bars). A, The mean IPSC amplitude.B, Mean Var =f(Imean) plot was obtained by averaging the Var values forImean over a 5% amplitude interval.C, The average parameter A of the adjusted parabolas, which refers to quantal size, q.D, The relationships between IPSC amplitude and extracellular [Ca2+/Mg2+]. The data were normalized to values observed at [Ca2+/Mg2+] = 0.14 to highlight possible differences. E, The average 1/Bratio, which refers to n. F, Relationships between P parameter (see Eq. 8), which refers topo*pA, and extracellular [Ca2+/Mg2+]. InA, B, and E, a significant difference (p < 0.001) was found compared with controls;C, D, and F show a nonsignificant difference (p > 0.5).
