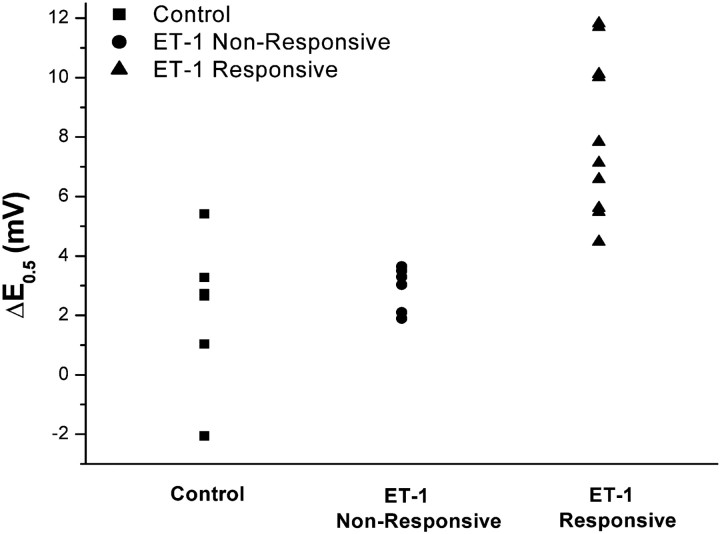
Fig. 2.
Scattergram showing the distribution of changes in activation midpoint potentials (ΔE0.5) of individual DRG neurons unexposed to ET-1 (Control; changes after 10 min), exposed to ET-1 but with ΔE0.5 < −4 mV after 10 min (ET-1 Non-Responsive), and exposed to ET-1 and having ΔE0.5 > −4 mV after 10 min (ET-1 Responsive).

