
Fig. 1.
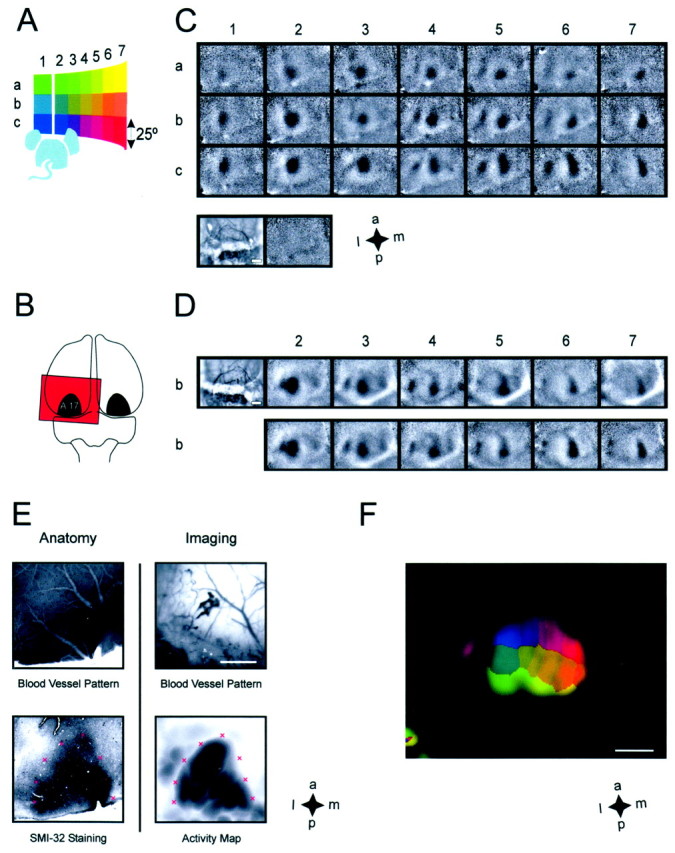
Imaging cortical retinotopy in mice.A, For retinotopic stimulation, we used square-shaped windows of gratings (25° side lengths) at adjacent positions within the visual field. The color code representing stimulus position was used to generate the color-coded retinotopic maps. Thewhite line indicates the vertical midline.B, Schematic of the imaged cortical region as indicated by the red window, which contains a rough outline of area 17. C, Blank corrected single-condition maps from one animal, with each map corresponding to a stimulus inA, according to the indices. All maps are scaled and clipped to the same absolute values. The cortical blood vessel pattern imaged through the translucent skull is shown at the bottom left. The map next to the blood vessel image displays the difference between images taken during two independent blank screen presentations. D, Reproducibility of the imaged maps from a different animal. Both sets corresponding to stimulib2–7 were averaged across 24 repetitions per stimulus imaged during subsequent blocks of data acquisition. Theelongated white region visible in the bottom right of some of the maps is most likely an artifact caused by the venous sinus. The blood vessel pattern is shown at theleft. Note that cortical blood vessels are clearly visible in the anterior part of the imaged region, whereas they appear very blurred in the posterior part, because of a different structure of the bone above this region. Despite this, activity maps could be readily imaged in this region as well. E, Anatomical verification of imaging in the primary visual cortex. The superficial blood vessel pattern (top panels) was used to align SMI-32 staining reflecting the anatomical position of area 17 (bottom left panel), with the maximum intensity projection of the intrinsic signal across all single-condition maps (bottom right panel). The red crosses were placed at the same positions in the staining pattern and the imaged map. F, Color-coded map of the overall retinotopic organization of area 17: the colorof each pixel corresponds to the stimulus position that elicited the strongest signal at this pixel. To mask out regions without cortical response, color saturation equals the maximum intensity projection of all single-condition maps. Scale bars, 1 mm.