
Fig. 5.
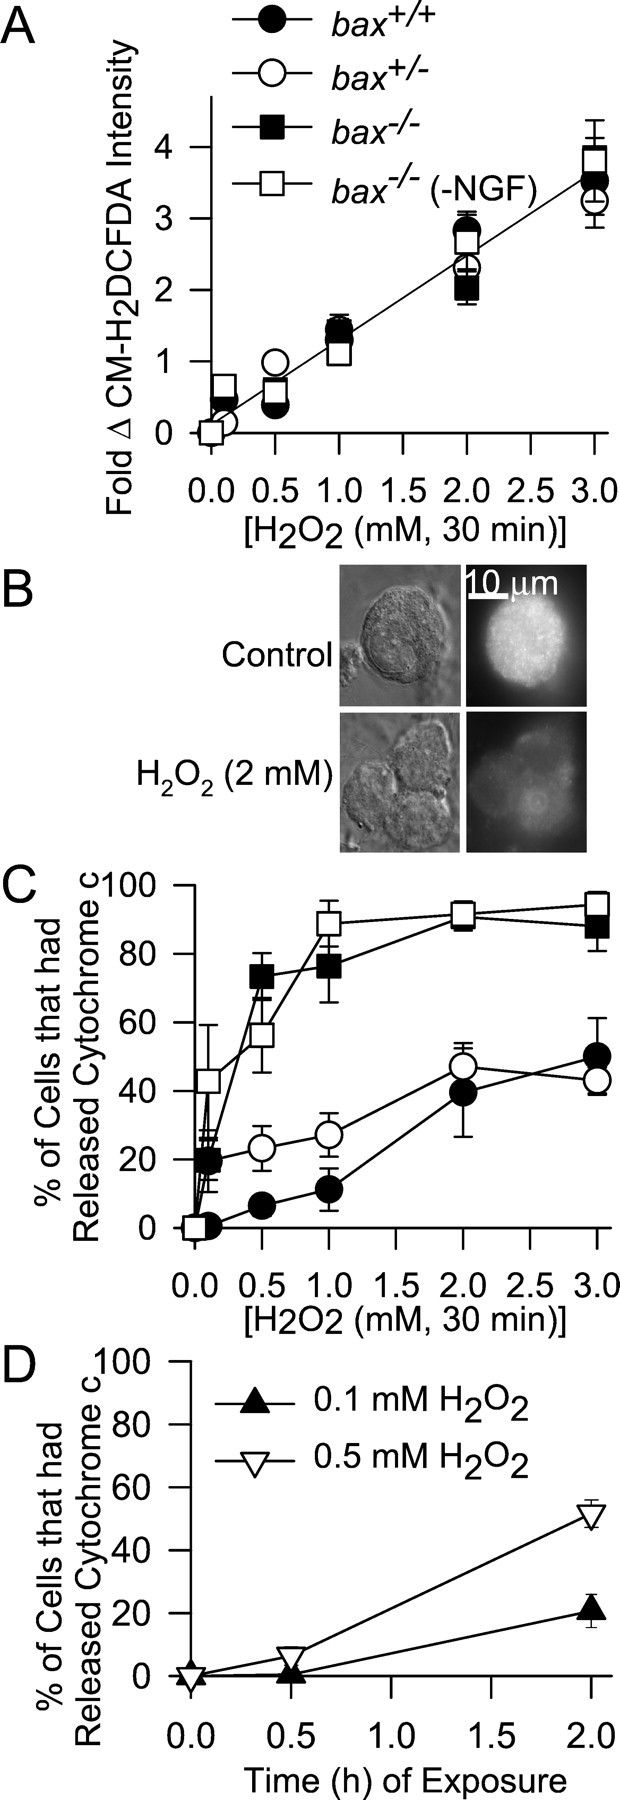
Increasing ROS with H2O2causes cytochrome c release independent of Bax.A, Effect of different concentrations of H2O2 on ROS levels (CM-H2DCFDA intensity) in NGF-maintained neurons from the three baxgenotypes and on ROS levels inbax−/− neurons deprived of NGF for 18 hr. After cells were loaded with CM-H2DCFDA, the dye was washed out, and cultures were exposed to H2O2 in the incubator for 20 min. They were then washed three times with L-15 medium and left in the second wash for confocal microscopy. The line shows a linear regression of all the data (R > 0.99).n = 45–128 neurons. B, Cytochromec was lost frombax−/− neurons after H2O2 exposure. Top panels, Paired DIC and fluorescent micrographs of a control (+NGF)bax−/− cell immunostained for cytochrome c. Bottom panels, Similar cells after treatment with H2O2 (2 mm). Cultures for were exposed to H2O2 in NGF-containing medium for 30 min. They were then washed twice with NGF-containing medium without H2O2 and returned to the incubator for 30 min before processing for immunocytochemistry. Western blots of total cytochrome c (mitochondrial and cytoplasmic) and tubulin in cultures exposed to H2O2 confirmed loss of cytochrome c without tubulin loss (data not shown).C, Effect of different concentrations of H2O2 on cytochrome c release in NGF-maintained neurons of the three bax genotypes and onbax−/− neurons deprived of NGF for 18 hr. Cells were exposed to the indicated H2O2concentrations for 30 min, washed two times with culture medium containing or lacking NGF, as appropriate, and returned to the incubator for another 30 min to assure degradation of released cytochrome c (Deshmukh et al., 1998; Neame et al., 1998; Kirkland and Franklin, 2001). Release was determined as in Figure 2. Symbols have the same meaning as inA. Data are from 3–11 cultures. D, Time-dependent effect of H2O2 on cytochromec release. Concentrations of H2O2 that had little effect on cytochromec redistribution after 30 min of exposure caused release when neurons (bax+/+) were treated with these concentrations for longer periods. H2O2 was replenished every 30 min. Data are from three to five cultures. The cytochrome c status of 50–100 neurons was determined for each culture in C andD.