
Fig. 1.
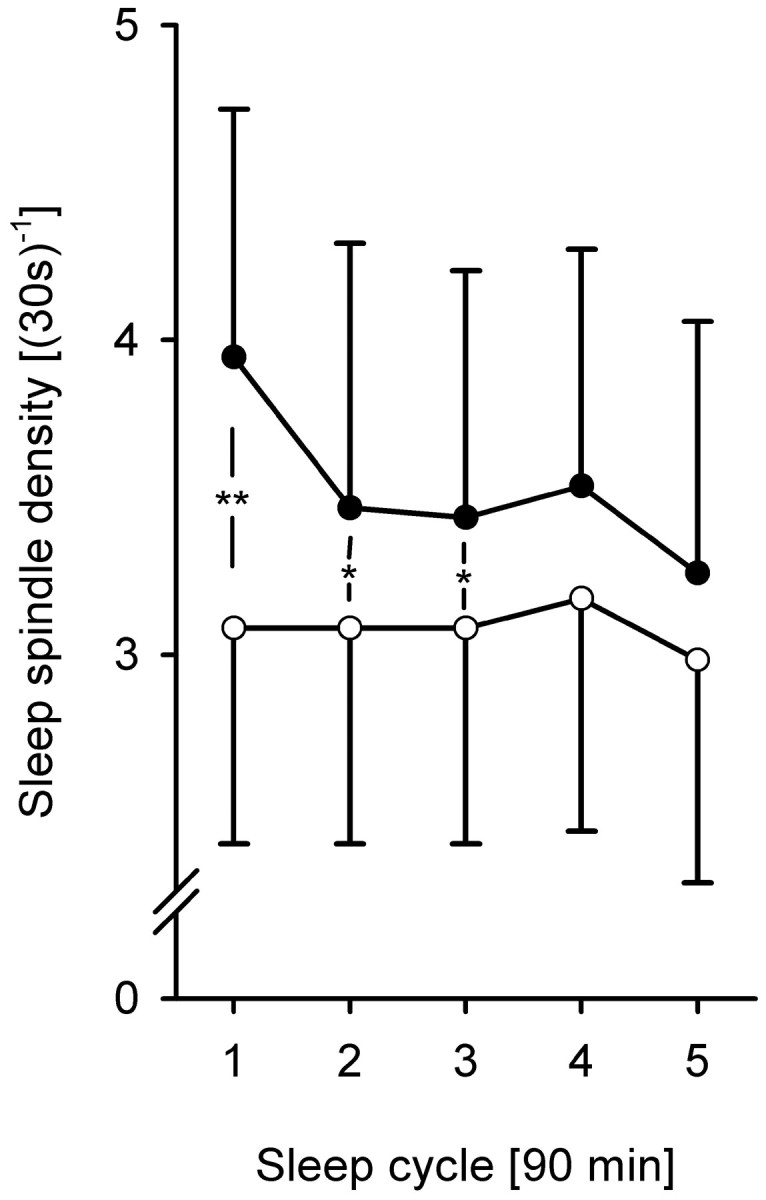
Mean number of sleep spindles at Fz per 30 sec epoch during S2 in each 90 min sleep period over the course of the night. Filled circles represent the learning, andopen circles represent the nonlearning condition. There is a notable decrease in spindle density over the night after learning (p < 0.01), which cannot be observed in the nonlearning condition (p > 0.50). Also, learning and nonlearning conditions differ significantly during the first three 90 min periods (**p < 0.01; *p < 0.05). Large SEM values are attributable to the individual differences in spindle density, not to differences between conditions.