
Fig. 2.
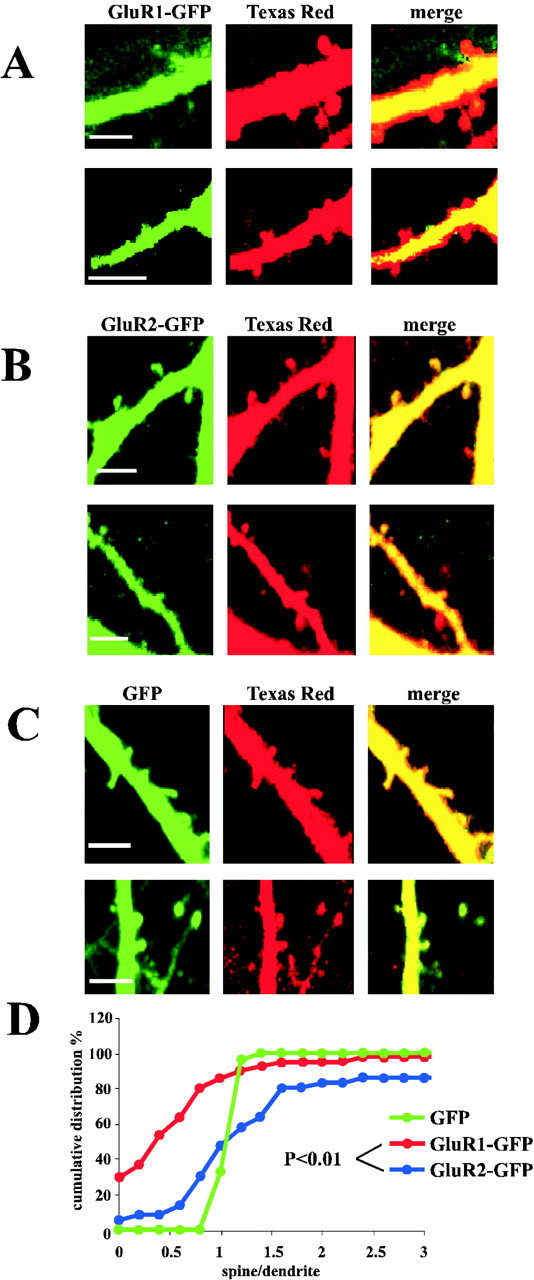
GluR1 and GluR2 show different expression levels in spines. Dual-channel images of apical dendrites show that GluR1–GFP appears restricted from dendritic spines (A), whereas GluR2–GFP is detectable in dendritic spines (B). Scale bar, 5 μm.C, Dual-channel images of apical dendrites show that the distribution of GFP and Texas Red are virtually identical. Scale bar, 5 μm. D, Cumulative distribution of the [G/R]spine/[G/R]dendfluorescence values GluR1–GFP are almostall <1. The GluR2–GFP [G/R]spine/[G/R]dendvalues are not significantly different from those in the dendrites (spine–dendrite pairs: n = 41 for GluR1–GFP,n = 36 for GluR2–GFP, and p = Kolmogorov–Smirnov test between GluR1–GFP and GluR2–GFP). Cumulative distribution of the GFP [G/R]spine/[G/R]dendfluorescence values shows no difference between the two channels (s/d ∼1; n = 24).