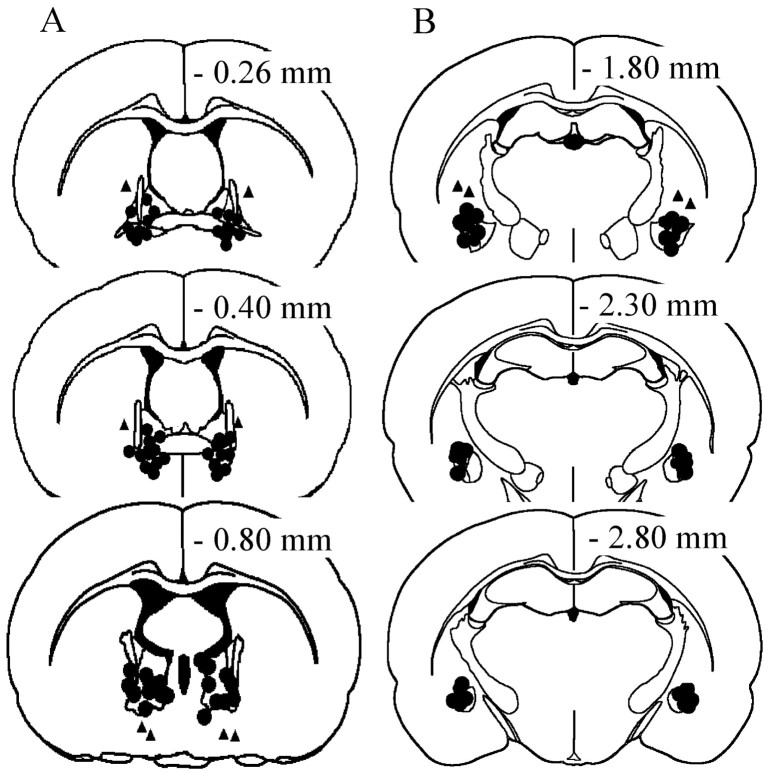
Fig. 1.
Distribution of infusion sites in the BNST (A) and in the region of the CeA (B), plotted on drawings of coronal sections from the atlas of Paxinos and Watson (1997). The triangles inA and B represent infusion sites outside the intended regions.

