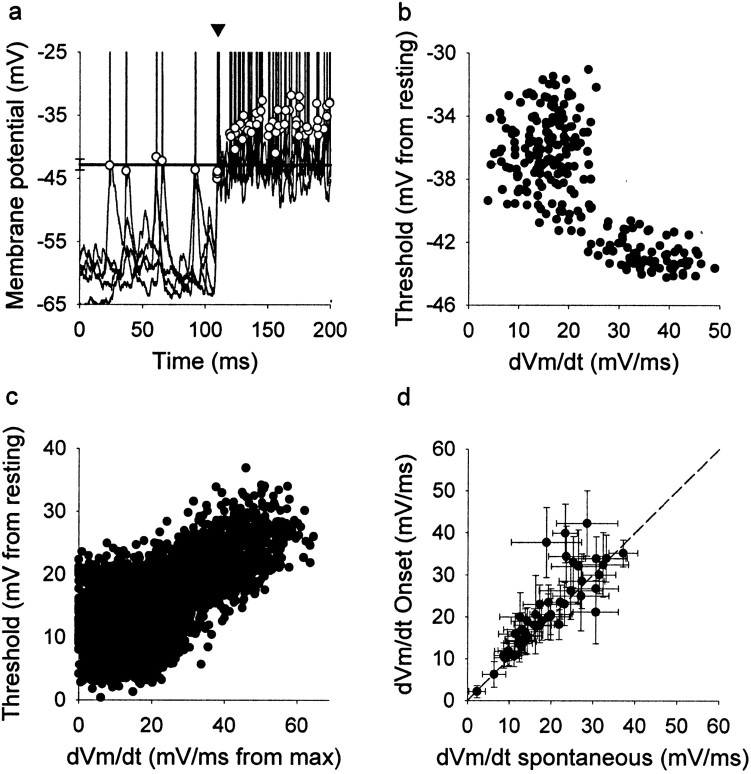
Fig. 6.
Spiking threshold. a, Automatic computation of thresholds in four overlaid traces from a single neuron.Circles indicate the threshold for each spike. Thearrowhead indicates the onset spikes in the response induced by sound. The thresholds of all onset spikes fall below the mean threshold of spontaneous spikes (solid line). Sound stimulation starts at 100 msec.b, Plot of the spike threshold versus the rate of depolarization (dVm/dt) of the same neuron as ina. The threshold is lower when the rate of the preceding depolarization is steeper. c, The rate of depolarization is inversely correlated with the spike threshold in a subset of 20 neurons. The threshold decreases (moves closer to the resting potential) when the rate of depolarization that precedes the spikes increases (gets closer to the maximum rate). d, In most neurons (45 of 52 neurons), the rate of depolarization preceding the onset spike evoked by sound shows higher values than for spontaneous spikes. Error bars indicate SEM. The dashed linewould result if the rate of depolarization were the same for spontaneous and sound induced spikes.

