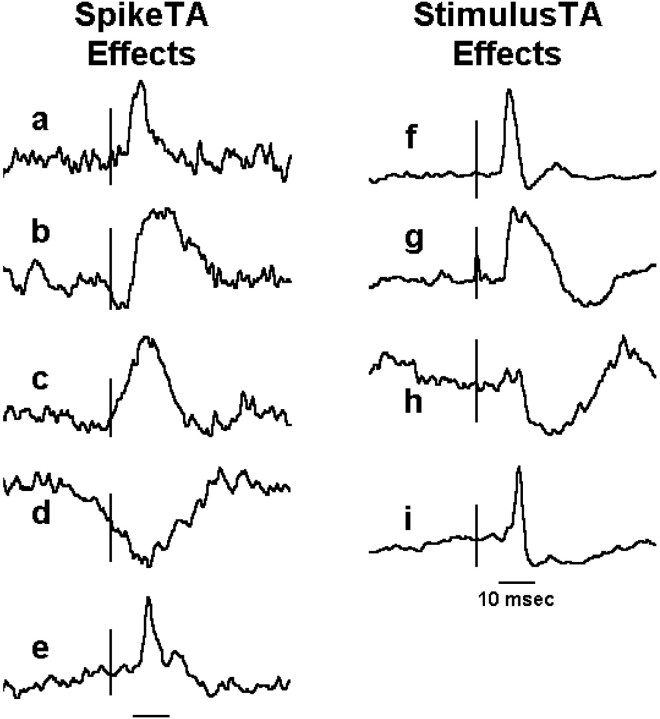
Fig. 2.
Illustrative examples of effects in SpikeTAs and StimulusTAs. Vertical bars indicate the time of the triggering M1 neuron spike (left column) or sICMS pulse (right column). Short horizontal barsbeneath each column represent the 10 msec test window, from 6 to 16 msec after the trigger, in which each average was examined for a significant peak or trough. Each trace is 80 msec long (from 30 msec before to 50 msec after the trigger) and is scaled vertically to fill a constant height from the minimum to the maximum value. See Results for a detailed description of each example.

