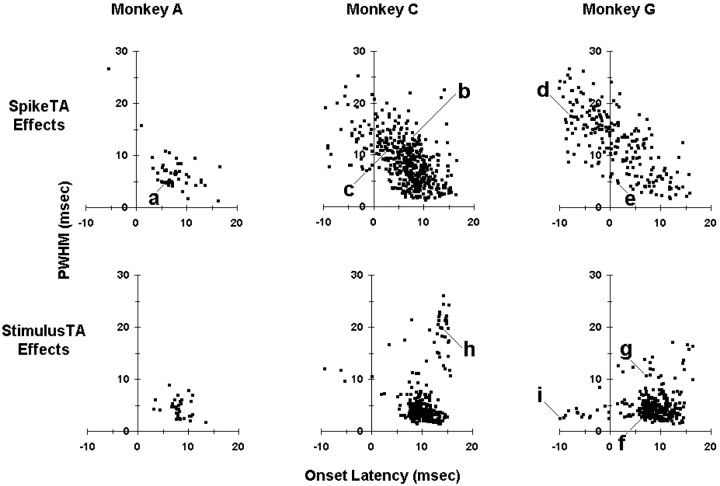
Fig. 3.
Scatter plots of onset latency (abscissa) versus PWHM (ordinate) for each significant SpikeTA effect (top row) or StimulusTA effect (bottom row) from each monkey: A (left), C (middle), and G (right). a–i indicate the points representing the example effects shown in Figure 2.

