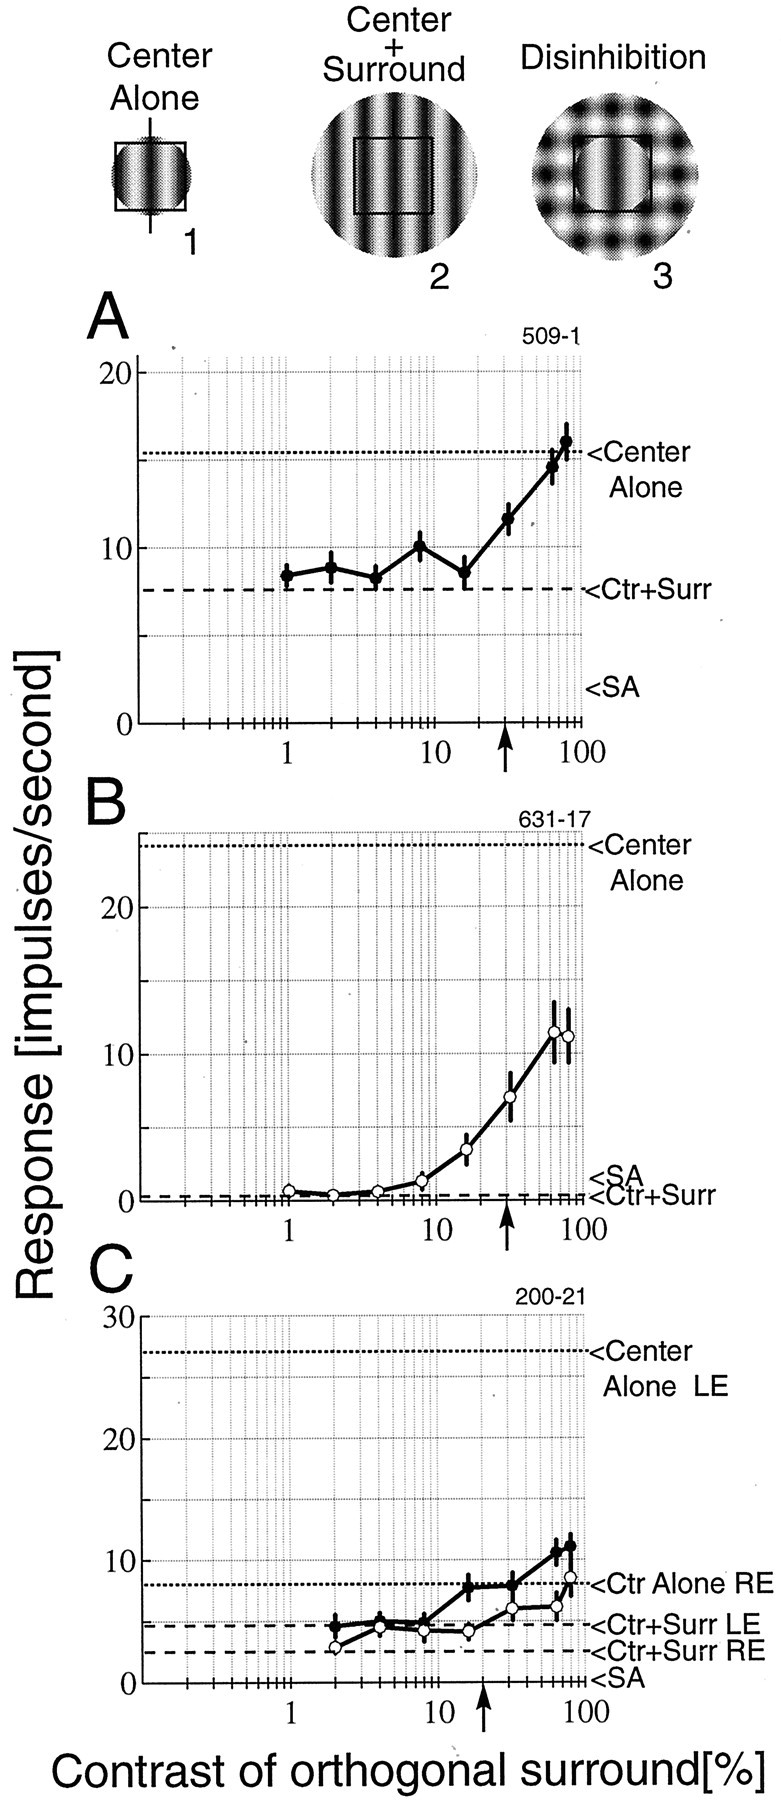
Fig. 2.

Three examples are illustrated of the effect of contrast of the surround grating on the responses of cells. Examples of typical stimuli are shown above the plots and represent theCenter Alone (icon 1) andCenter + Surround (Ctr +Surr; icon 2) baseline measure shown on the plots by dashed lines. Also shown is an example of the disinhibition stimulus (icon 3). This example depicts the test pattern when the orthogonal grating matches the contrast of the optimal grating. A, A complex cell exhibits strong suppression that is fully disinhibited with a high-contrast orthogonal grating. B, A simple cell is completely suppressed by the optimal surround. The response is strongly disinhibited but only recovers approximately half of the optimal response. C, Responses of a binocular simple cell are illustrated in which both eyes exhibit surround suppression anddisinhibition. The left eye (LE;filled symbols) is dominant and is strongly suppressed by the optimal surround grating. Minor recovery is observed for this eye. For the nondominant right eye (RE; open symbols), the cell fully recovers an optimal response with a high-contrast orthogonal surround grating. Thearrowheads on the x-axis denote the contrast of the optimal grating. SA, Spontaneous activity.
