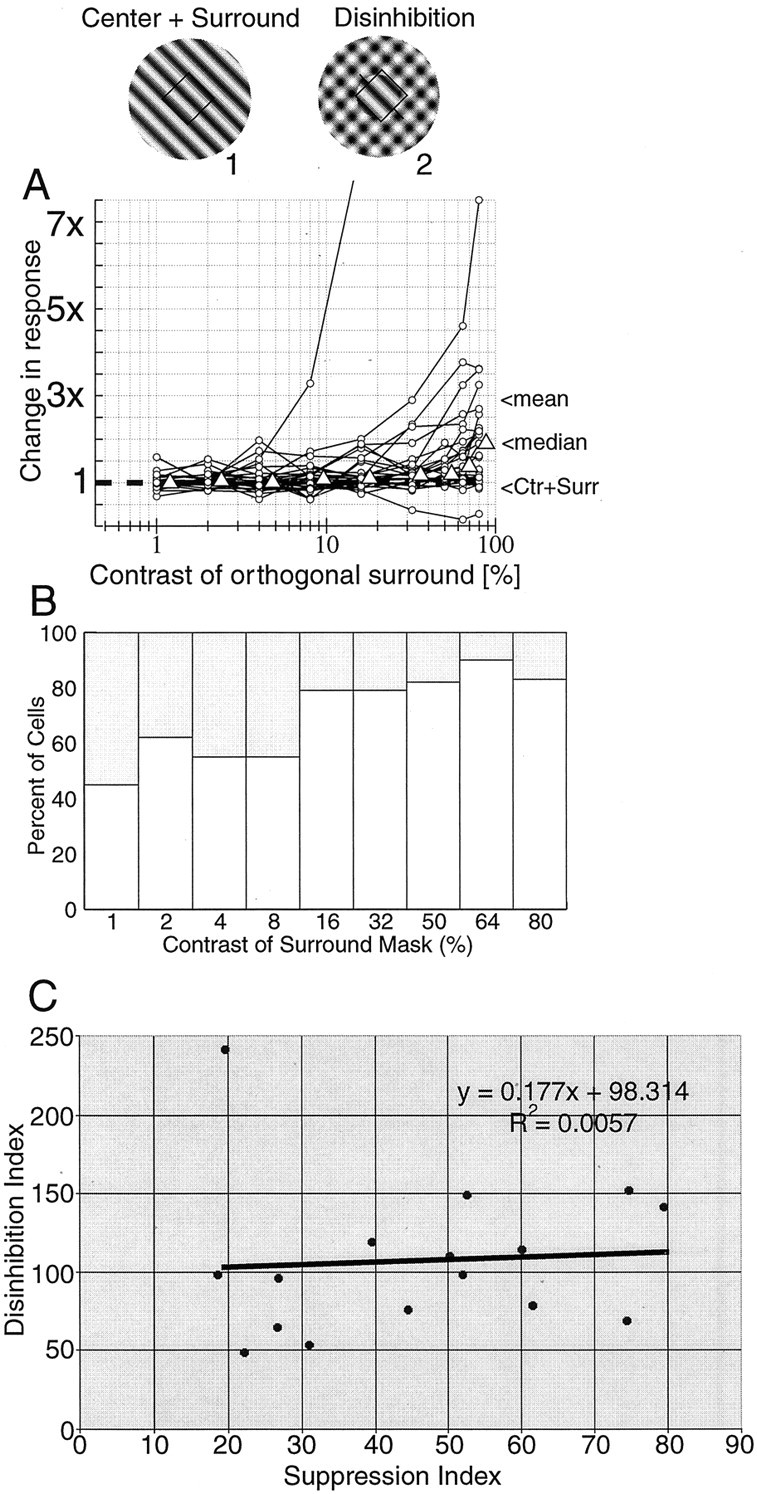
Fig. 3.

A summary is shown of disinhibition with full-field optimal gratings and annular, orthogonal gratings (29 data sets). In A, the responses from each cell are normalized to the response to the large optimal grating [center plus surround (Ctr + Surr)], so1 on the plot is the baseline response when an optimal grating that covers both the center and surround is presented. The open triangles reflect the median value at each contrast level (slightly offset to the right for visibility). The median gives a more conservative estimate of the effect than the mean, which can be skewed by the cells with large changes in response. The one curve that rises dramatically beginning at 4% contrast reaches a peak of 29.2 times the suppressed response. This enormous increase in response is attributable partly to an almost complete suppression by the surround. The response of the cell is given in Figure 2B. For comparison, the cell in Figure2A responds 2.1 times greater in the plaid condition compared with the optimal center plus surround condition. The mean and median change in response at 80% contrast of the orthogonal surround grating is 2.99 and 1.89, respectively. In B, histograms are given of the numbers of cells for which response increased (open bars) or decreased (shaded bars) when an orthogonal grating of different contrasts is superimposed on the optimal grating in the area outside the CRF. InC, a suppression index is plotted against a disinhibition index. The suppression index is defined as follows: (RC+S/Ropt) × 100%, where RC+S is the response to the full-field stimulus covering the center and surround, andRopt is the response of the cell to the optimal stimulus presented to the center alone. The disinhibition index is defined as follows: (RC+plaid/Ropt) × 100%, where RC+plaid is the response to the optimal stimulus presented in the center and the plaid stimulus (at 80%) presented in the surround. Ropt is as defined above. With this index, a value of 0 indicates no response from the cell, 100 indicates that the response with the plaid is equal toRopt, and values above 100 indicate responses that are stronger than Ropt.
