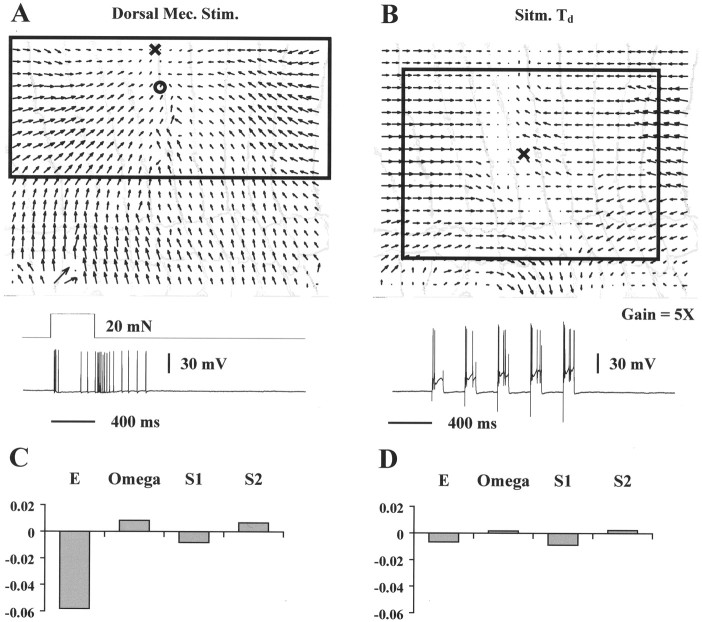
Fig. 11.
T cell contribution to motor response.A, Optical flow induced by mechanical stimulation (20 mN for 400 msec) in the dorsal side of the segment. Symbols as in Figure9. The bottom traces show the duration of the stimulus and the spikes that it evoked in the dorsal T cell. B, Optical flow induced by intracellular dorsal T stimulation cell with successive depolarizing current pulses (bottom trace).C, Elementary deformations computed for the vector field shown in A. D, Elementary deformations computed for the vector field shown in B. The boxes inA and B are linearization regions for the corresponding optical flows. The width of the annuli inA and B is ∼0.6 mm. Equal normalization in C and D.

