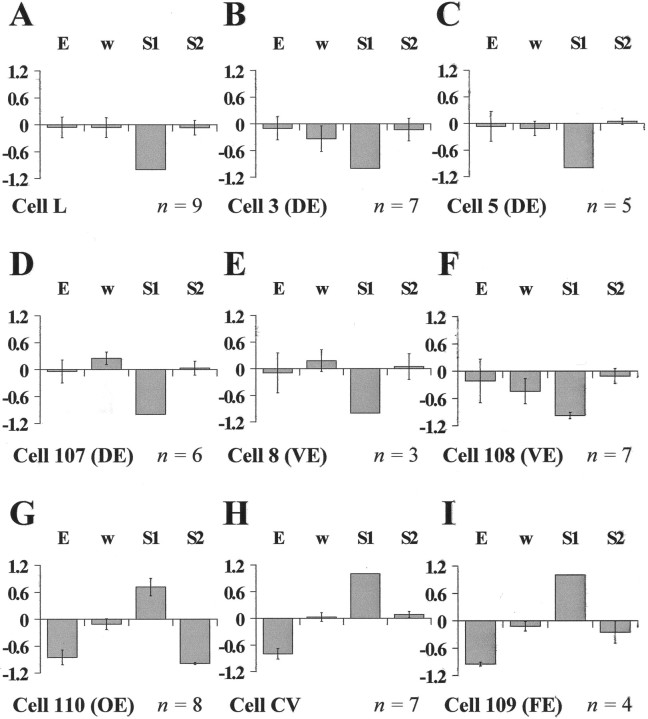
Fig. 5.
The average relative weights of the elementary deformations for different leech motoneurons. A–I show the mean relative weight of expansion (E), rotation (ω), and the two shearsS1 and S2 for the nine motoneurons analyzed in Figures 2 and 3. All components were normalized to the largest of them before averaging. The number of preparations used for each motoneuron is reported in the bottom right corner of each panel. Error bars indicate SEM.

