
Fig. 3.
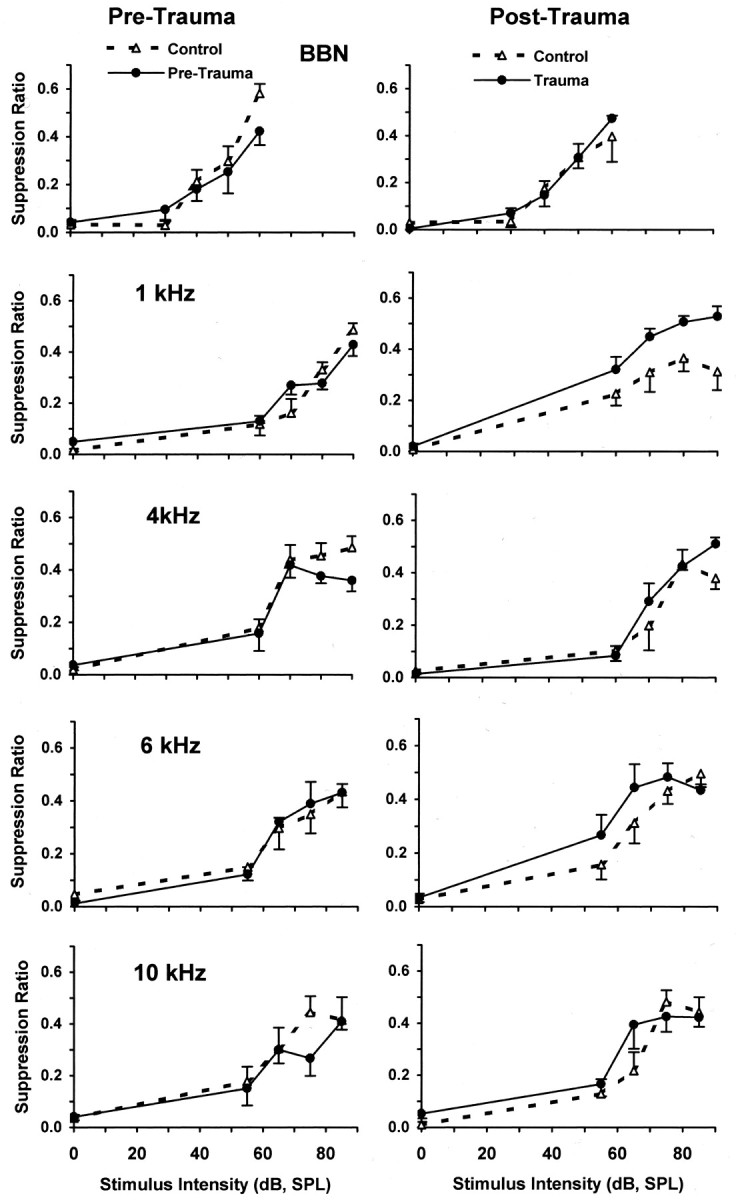
Pre-trauma versus post-trauma psychophysical discrimination functions (error bars indicate 1 SEM). Pre-trauma (left panels) and post-trauma (right panels) psychophysical discrimination functions for control (no trauma) and trauma-exposed subjects (n = 4/group) are shown. Test stimulus values are indicated in each panel. Suppression ratios reflect the discrimination performance of subjects, with a value of 0 indicating discrimination of 0 dB, and a value of 0.5 indicating discrimination of sound comparable to that of 60 dB broadband noise. The only significant difference between control (dashed lines) and trauma-exposed (solid lines) groups was for 1 kHz tones after trauma (see Table 1 for significance levels).