
Fig. 1.
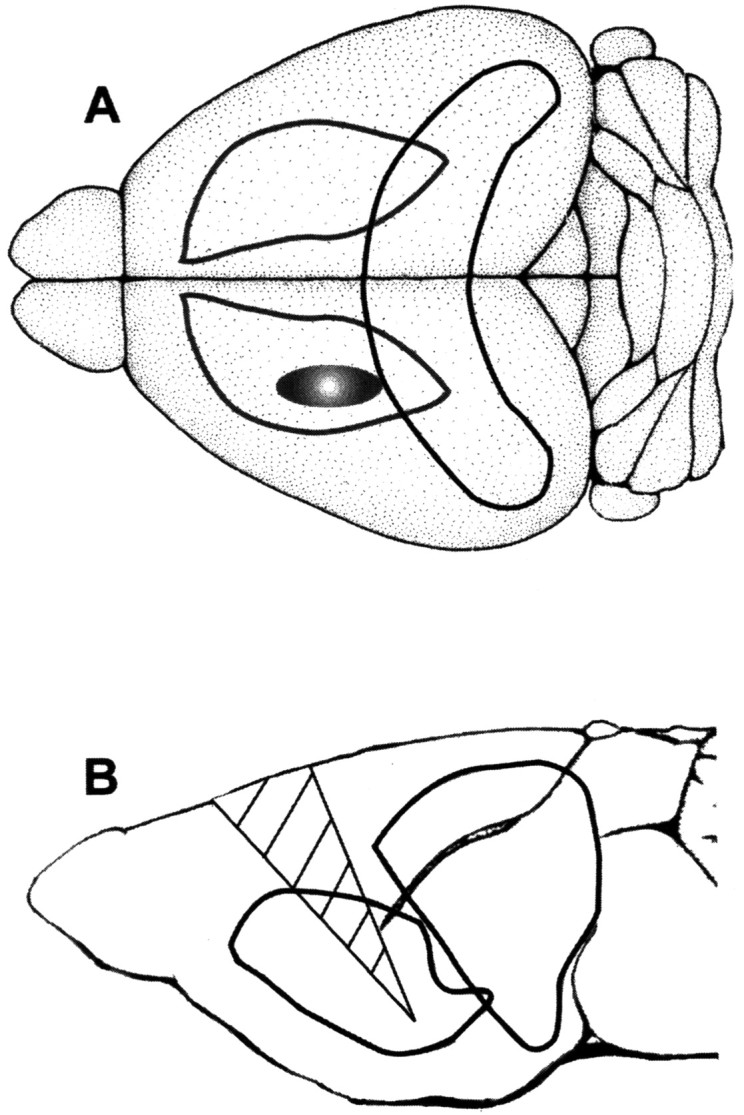
Location of xenograft and needle tract in the brains of SCID mice. A shows a schematic representation of the position of human MDMs injected into the left basal ganglia of SCID mice. The ellipse represents the sum area occupied by human MDMs. The hippocampal formation is also shown. The triangle in B shows the sum of needle tracts for all mice injected with HIV-1-infected or uninfected MDMs or vehicle control. The fissure represents the lateral ventricle.