
Fig. 5.
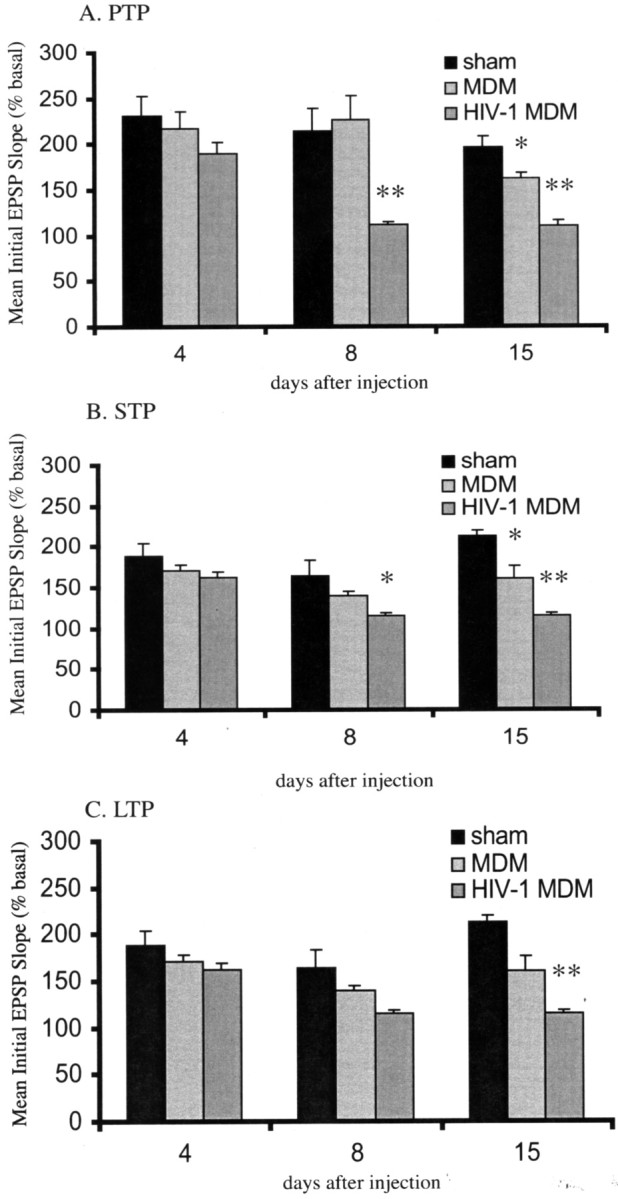
HFS-dependent PTP, STP, and LTP. The bar graphs depict average percentage change in field EPSP slope compared with basal (pretetanic) in the hippocampal CA1 subfield. Basal values for each group were gathered 15–5 min before high-frequency stimulation (t = 15–25 in Fig. 1). PTP, STP, and LTP were measured at t = 31–35, 40–45, and 85–90 (Fig. 4). Statistical comparisons were made against shams (*p < 0.01, **p < 0.001; ANOVA, Tukey-Kramer).