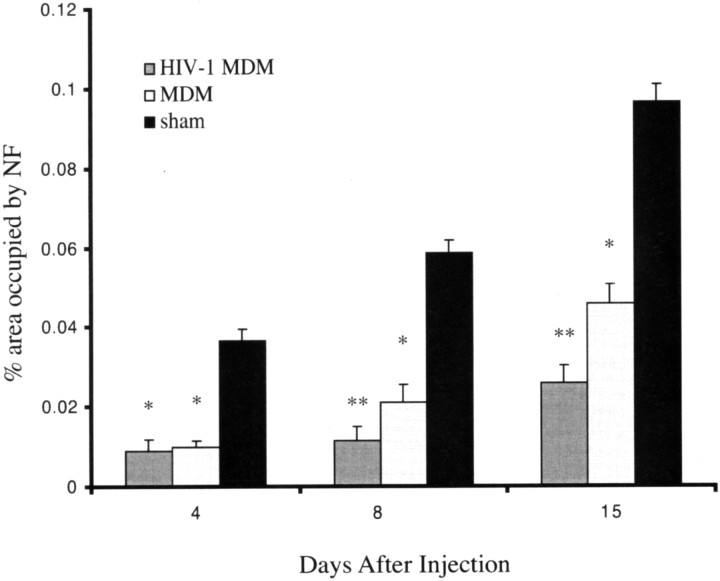
Fig. 8.
Neurofilament (NF) expression within the CA2 hippocampal subfield ipsilateral to injection. After slides were analyzed on low power (20×), the region of highest NF intensity was selected, photographed at 100× magnification, and quantified using ImageQuant software. Statistical comparisons were made against shams (*p < 0.05, **p < 0.01; ANOVA, Tukey-Kramer).

