
Fig. 2.
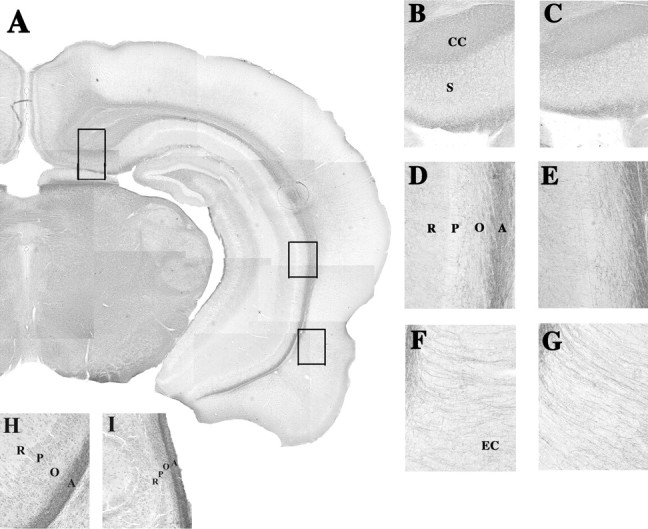
Photomicrographs of Black–Gold-stained sections through the hippocampal formation of sham (A, B, D, F) and neonatally TTX-infused (C, E, G) rats killed at postnatal day 42. A, A composite of a Black–Gold-stained coronal slice at 40× magnification through the brain of a sham animal cut at the level corresponding to plate 40 of the rat atlas of Paxinos and Watson (1986) (bregma −5.6 mm).Insets, Higher magnifications (200×) of dorsal subiculum (B, C), CA2 (D, E), and entorhinal cortical (F, G) regions from sham and TTX brains, respectively. Higher magnifications (200×) of the CA2 from sham (H) and neonatally (P7) ibotenic acid-lesioned rats (I) were prepared as described by Lipska et al. (1993); rats were killed at postnatal day 42. CC, Corpus callosum; EC, entorhinal cortex; S, subiculum. CA2 area layers: O, Oriens; P, pyramidal cells; R, stratum radiatum; A, alveus.