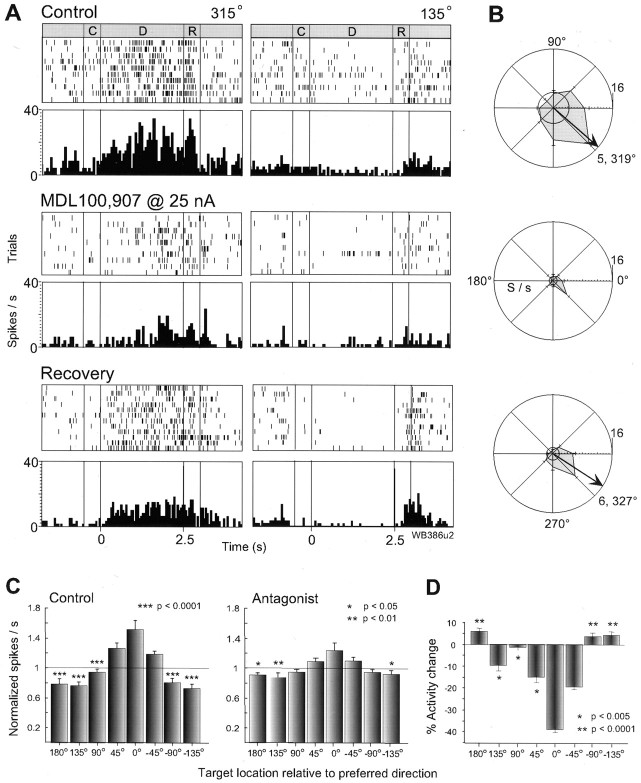
Fig. 2.
Effects of 5-HT2A blockade on RS neurons. A, Rastergrams and average histograms of the activity of one RS neuron (C, cue; D, delay; R, response period; bin = 50 msec). Thetop panel shows activity during the control condition in which an elevation of activity can be seen during the delay and early response period for the preferred direction at 315° (left), and only a postsaccadic response for the nonpreferred location at 135° (right). Iontophoresis of MDL100,907 (middle panel) attenuated the delay and presaccadic activity at 315° and the postsaccadic activity for the opposite target location. After drug application was ceased (bottom panel), the delay activity partially returns toward that in control. B, Mean and SE polar plots of the firing rate of the same cell during the delay period for each target location (arrow: vector angle of tuning;inner circle indicates background activity). A memory field can be seen in the control condition (top) that is diminished by the 5-HT2A antagonist (middle). In recovery (bottom), the memory field returns in a similar shape, although smaller in size.C, Population analysis of the delay activity of 28 tuned RS cells tested with 5-HT2A antagonists in the control (left) and drug (right) conditions. As described in Materials and Methods, the cells are first normalized for their preferred target location which is set to 0° and then the activity for each target location, relative to the preferred location is taken as a ratio to the mean for the delay activity of the cell across all target directions (shown byline). The histogram therefore depicts the dispersion of delay activity between preferred and nonpreferred target locations. A clear spatial profile can be seen in the control condition, which is highly diminished under 5-HT2A blockade (asterisks denote significant differences from the preferred direction). D, Histogram showing the percentage change in delay activity produced by 5-HT2Ablockade (for the same neuronal population), relative to the activity in the control condition for each target location (preferred direction again normalized to 0°). A reduction in activity can be seen for the preferred direction, greater than that for the two adjacentlocations, and a small increase in activity is evident for opposite locations in space.

