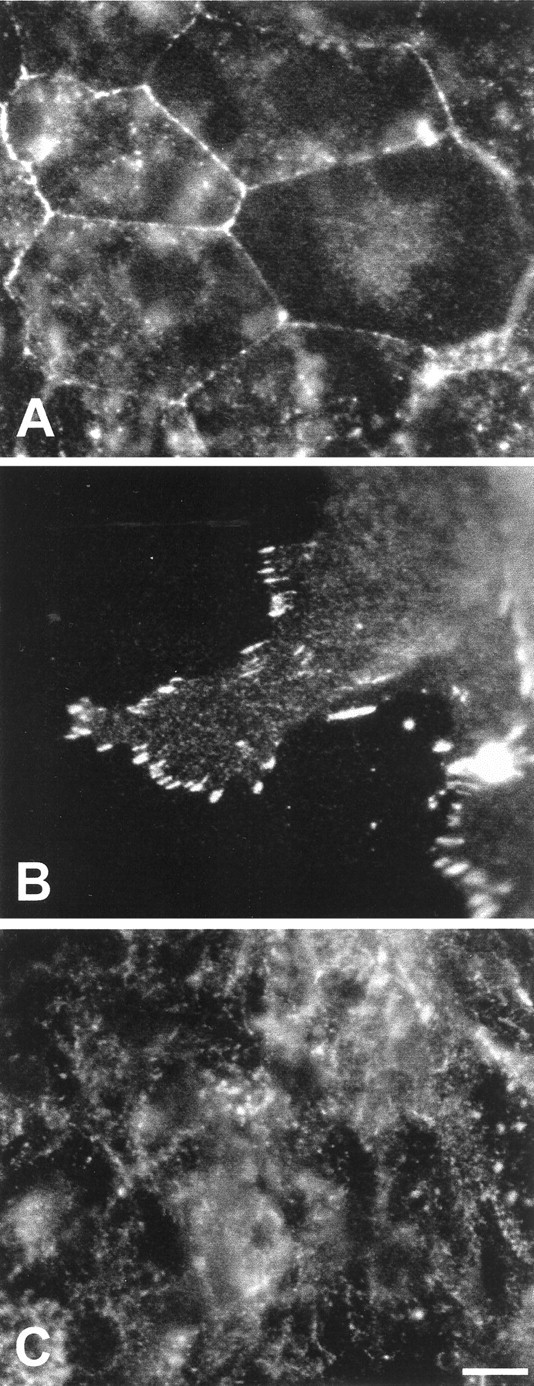
Fig. 4.

Patterns of pTyr immunoreactivity in the epithelial cultures. The location and intensity of pTyr labeling varied with cell density. In low-density regions of the cultures (where proliferation levels were high), intense pTyr activity was observed at cell–cell junctions (A) and focal contacts between the cells and the substrate (B). In contrast, pTyr labeling in the more quiescent high-density regions of the cultures was mainly diffuse and cytoplasmic (C). Scale bar, 10 μm.
