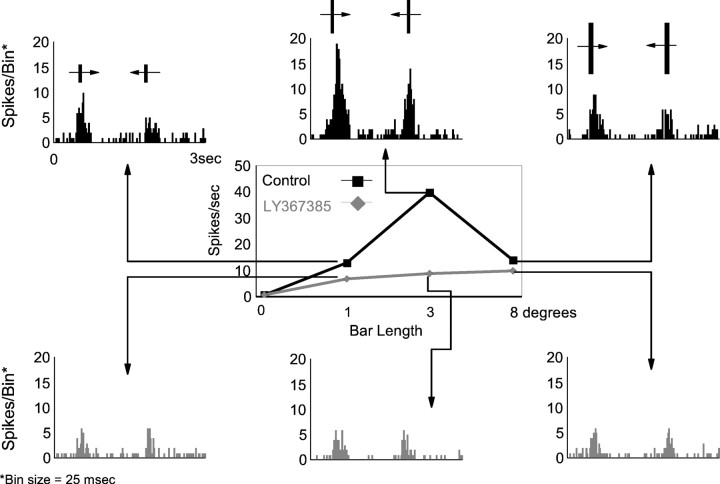
Fig. 3.
The effect of LY367385 on the length tuning of LGN cells. Data are taken from an OFF-center X cell. Length-tuning curves were constructed for a bar of varying length moving in both directions over the receptive field. Bar width in this case was 0.5°. The bar lengths were presented in a interleaved randomized sequence. Responses were averaged over 15 trials and assessed from the accumulated count in the bins constituting the response area in the PSTH after subtraction of the background discharge. Black curve is control response; gray curve is response during LY367385 application (6 min, 60 nA). For each length of the bar, the corresponding PSTH is shown. It is clear that the response decreases when the metabotropic antagonist is ejected. The strongest effect is seen for the optimal length (3° in this example).

