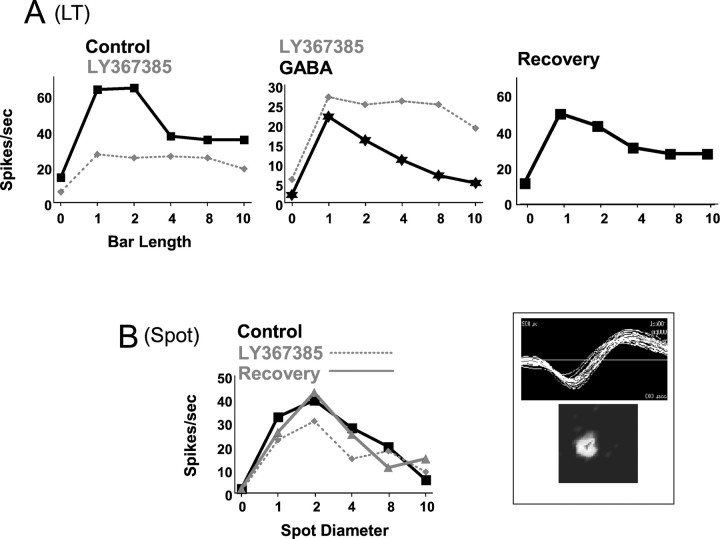
Fig. 6.
The observed effect is not caused by an unspecific decrease in excitability. Results are from an ON X cell.A, Length-tuning curve showing the response of the cell in different conditions: control versus LY367385 ejection (left), LY367385 versus GABA (center; notice the different scale in the y-axis), and recovery (right). B, Spot diameter tuning curve for the same cell in control, during LY367385, and recovery. Waveform and RF structure (in a 10 × 10° grid) are shown in theinset on the right.

