
Fig. 2.
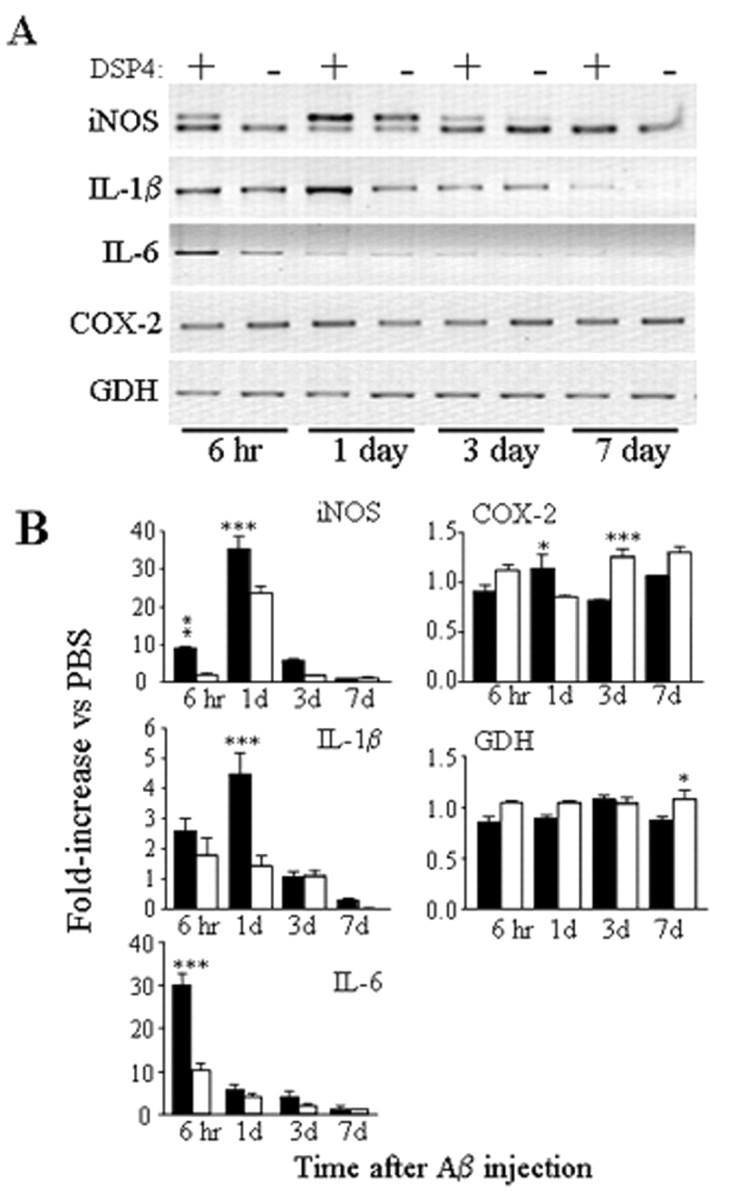
Inflammatory gene transcription in DSP4-treated animals and controls. A, Total RNA was prepared from cortices of DSP4-treated (+) and control (−) rats at the indicated times after intracortical injection of Aβ and examined by RT-PCR for iNOS, IL-1β, COX-2, and GDH mRNAs. For iNOS, PCRs were performed in the presence of 20 fg of a specific iNOS internal standard that yields a PCR product 40 bp smaller than the band derived from the iNOS cDNA. RT-PCRs were performed using RNA samples isolated from three animals in each group; representative gels are shown. B, Densitometric analysis of band intensities from three independent experiments. Filled bars, DSP4 animals; open bars, control animals. Data are the fold increase attributable to Aβ injection versus that attributable to saline injection (mean ± SEM). *p < 0.05; **p < 0.01; ***p < 0.001; DSP4-treated animals versus controls.