
Fig. 1.
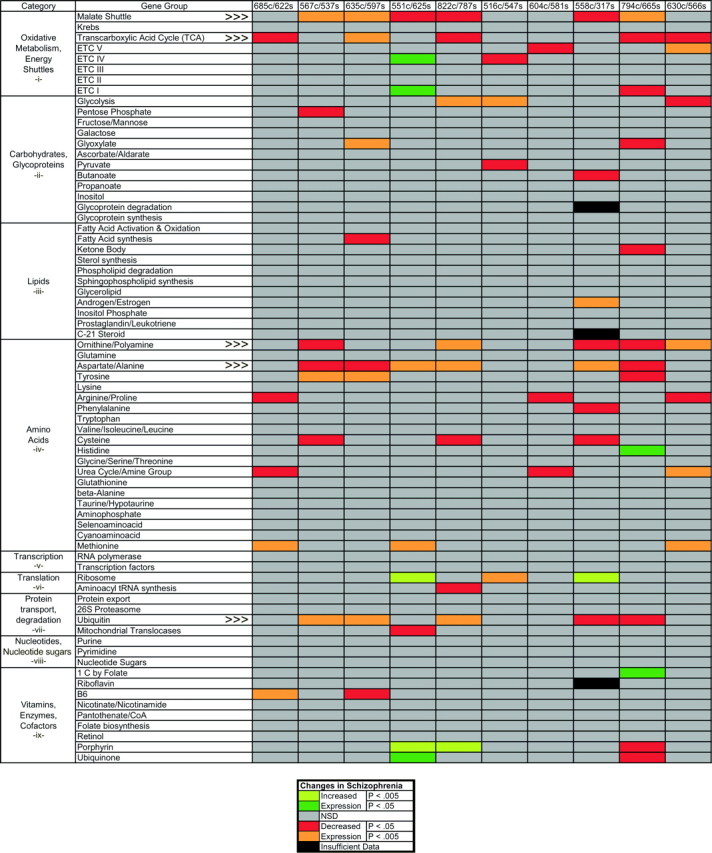
Metabolic gene group expression in schizophrenia. Genes in 71 different metabolic groups, belonging to several different categories of cellular functions, were analyzed in 10 subjects with schizophrenia and their matched controls. For each gene, a pairwise differential expression ratio was calculated and converted into a Z score for each array comparison. TheZ score distribution of all of the genes present in each gene group was then compared with the Z score distribution of each array using ANOVA, and the significance of the differences was estimated with a post hoc paired Scheffe's F test. The p values from these tests were entered into a table that was pseudocolored according to the level of the effect (key at the bottom). An average og 7.2 of the 71 gene groups were significantly changed in each of the five pairs compared using the UniGEM V microarray (right), whereas an average of 7.6 gene groups were changed in each of the five pairs compared using the UniGEM V2 microarray (left). Only five genes groups exhibited changes in expression (decreases) in five or more comparisons (indicated by arrowheads). The decreases in these five gene groups reached significance slightly more often in the UniGEM V2 comparisons (mean, 3.2 of 5) than the UniGEM V comparisons (mean, 2.2 of 5), although a complete shift of the mean Z scores of these groups was evident in all comparisons (see Fig. 2).