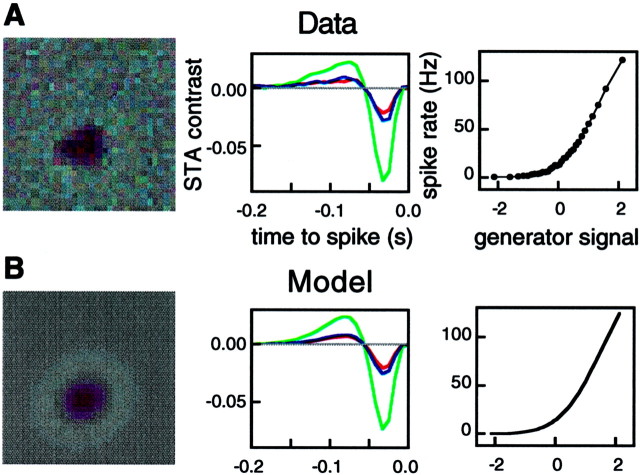
Fig. 1.
Characterization of light response and parametric fits. A, Left panel, The average stimulus observed 33 msec (4 frames, near time-to-peak) before a spike in one RGC. The dark central region reveals the receptive field of the cell. Middle panel, Average time course of contrast of the red, green, andblue display phosphors in the 250 msec preceding a spike, summed over 36 pixels in the center of the receptive field. The dominant negative lobe indicates that this is an OFF cell. Right panel, Average firing rate as a function of the generator signal (stimulus weighted by STA) observed during white noise stimulation. B, Parametric fits, as described in Materials and Methods, to the corresponding panels inA.

